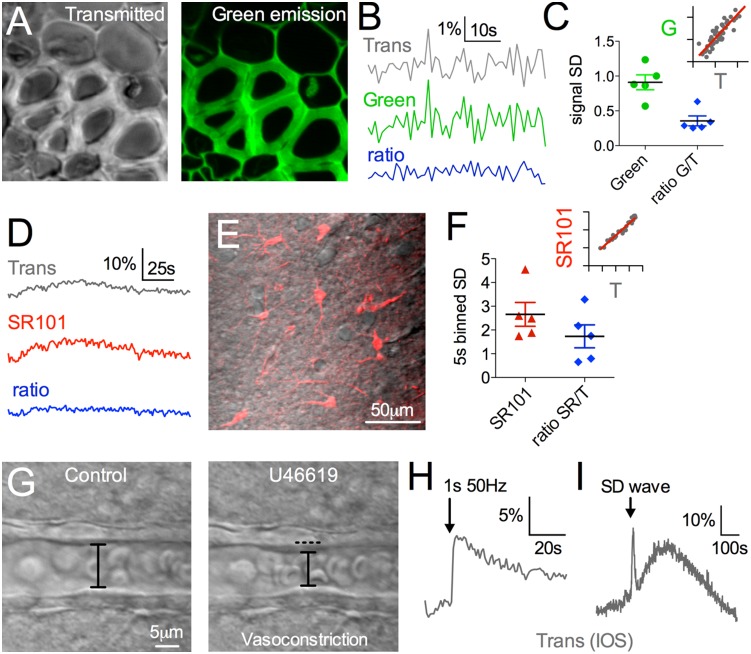
Figure 13. Microscope Performance: Under-stage transmitted channel.
A) Transmitted image (left) and green fluorescence (right) of Convallaria standard sample. B) Traces showing fast correlated noise between the green and transmitted channel. The ratio of the two signals eliminates the synchronous noise and reduces the SD in the signal. C) Summary bar graph. Inset shows correlation between the green and transmitted signal r = 0.89. D) Traces showing slow correlated oscillations between the red (SR-101) and transmitted channel in isolated tissue, acquired from region shown in E. The ratio of SR-101/Trans largely removes the undulation and reduces the SD on 5 s binned data, summarized in F. Inset shows correlation between the red and transmitted signal on 5 s binned data (r = 0.97). G) Transmitted images of a small arteriole before (left) and after vasoconstriction (right) caused by the thromboxane receptor agonist U46619 (200 nM). Intrinsic Optical Signals (IOSs) captured by the under-stage PMT in response to synaptic activity (H) and a wave of spreading depression (SD) (I).

