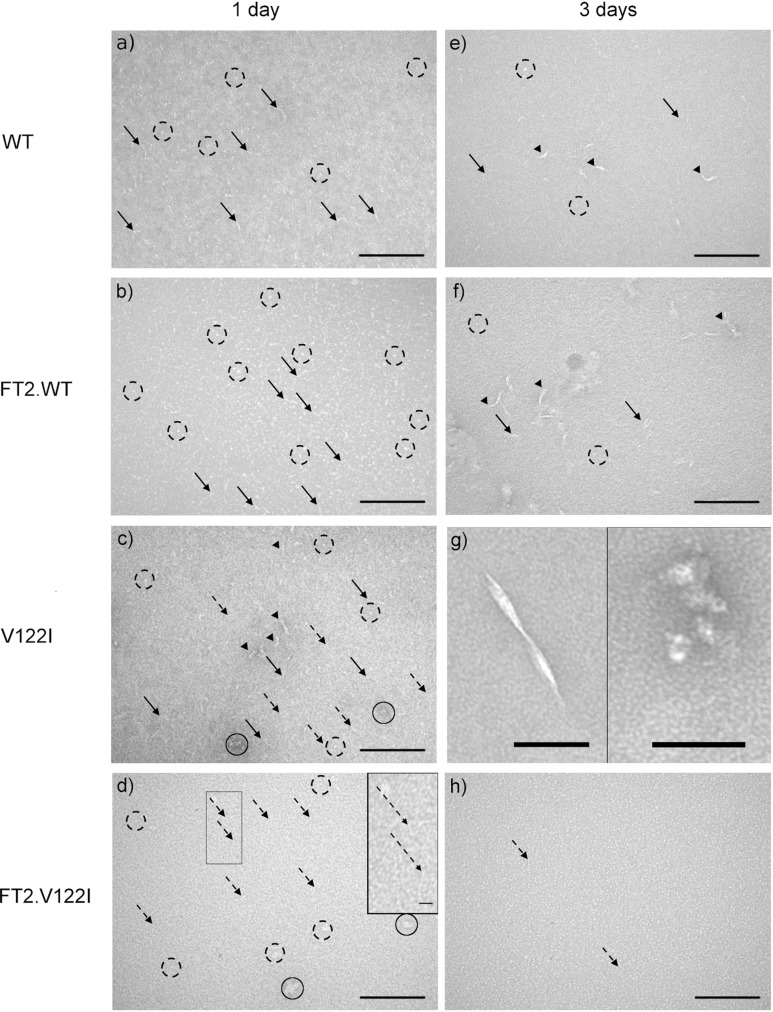
Figure 2.
Representative transmission electron microscopy (TEM) images of WT (a, e), FT2·WT TTR (b, f), V122I TTR (c, g), and FT2·V122I TTR (d, h) subjected to acid-mediated aggregation conditions for 1 (a–d) and 3 days (e–h) at 37 °C. All images were taken at 92 000× magnification. Scale bars in panels a–f and h represent 200 nm; scale bars in panel g (left and right images), 100 nm. Scale bar in the inset of panel d represents 40 nm.

