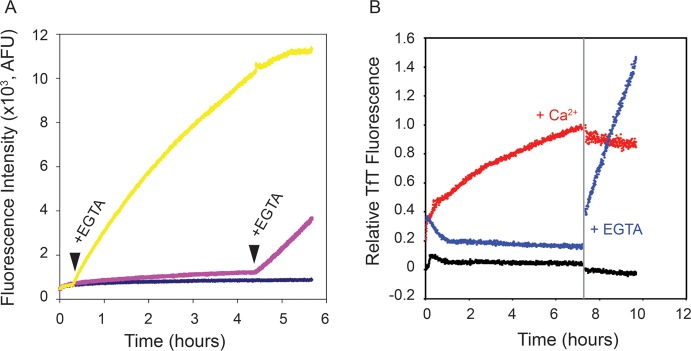
Figure 4.

Conformational dependence of RTX aggregation. (A) Ca2+-bound RTX protein was evaluated by ThT binding kinetically, and free Ca2+ was chelated by addition of EGTA. Points of EGTA addition are labeled and indicated by arrowheads. (B) The stability of the ThT-bound, Ca2+-free species was assessed by addition of Ca2+. The vertical gray bar marks the addition of Ca2+ (red data set) or EGTA (blue data set). Data for native RTX protein in 2 mM Ca2+ (black data set) are shown as a control.
