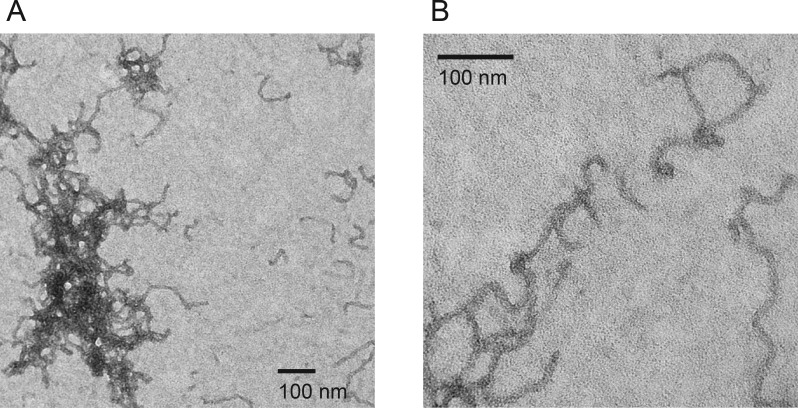
Figure 5.
Electron micrographs of RTX fibrils. Negative stain electron microscopy was used to visualize the structures formed by the Ca2+-free RTX domain. (A) Electron micrograph of the apo RTX domain fibrils. The RTX protein appears as regular fibrillar structures with a uniform width, but varying lengths and shapes. Nets or tangles of fibrils were most often seen, though individual fibrils were also visualized. (B) Electron micrograph of individual fibrillar structures. Fibrils appeared to be unbranched but often tangled and kinked.

