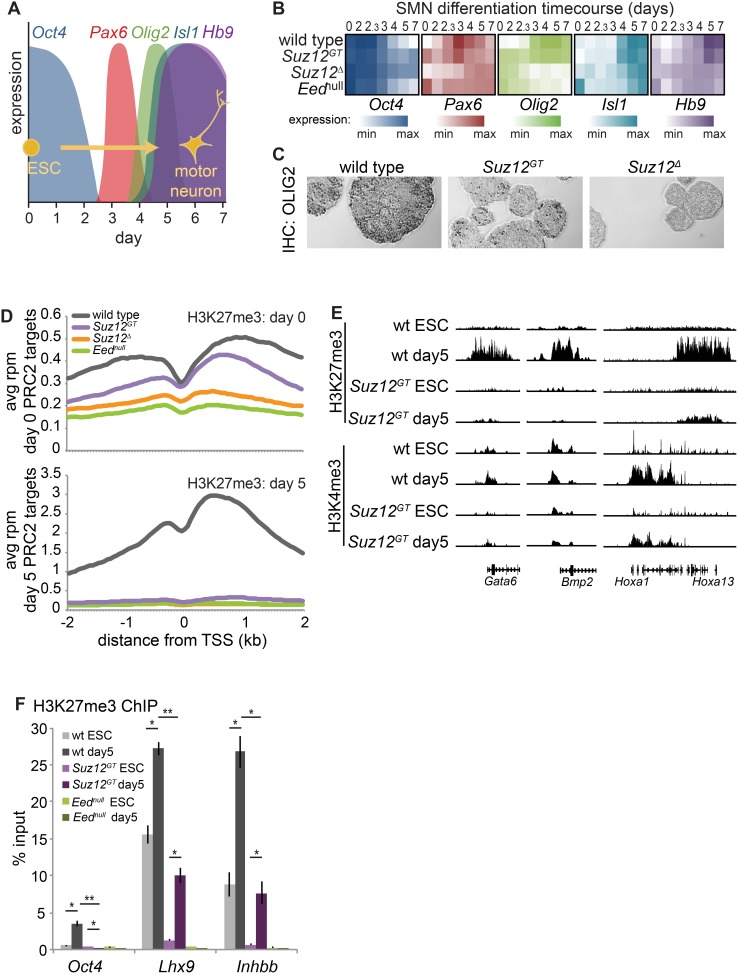
Figure 2. H3K27me3 levels show differences across SMN differentiation in Suz12GT cells compared to wt cells.
(A) Cartoon showing changes in marker expression across the spinal motor neuron (SMN) differentiation time course. (B) Heatmap of qRT-PCR analysis of genes from (A). White: minimum expression; saturated color: maximum expression level observed for that gene. Expression for each of the five genes is shown, log2 transformed, for wild-type (wt) (top), Suz12GT (2nd), Suz12Δ (3rd), and Eednull (bottom) cells. The time course progresses from left to right for 7 days. (C) IHC for OLIG2 on paraffin-embedded sectioned day 5 SMNs. OLIG2 expression is shown as darkly stained cells. (D) ChIP-seq enrichment for H3K27me3 is shown for wt, Suz12GT, Suz12Δ, and Eednull ESCs and corresponding day 5 differentiated cells. ChIP-seq datasets are represented as metagene plots showing average reads per million within 2 kb of all TSSs for wt, Suz12GT, Suz12Δ, and Eednull cells. Day 0 (ESC) is at top, while day 5 SMN is shown at bottom. (E) H3K27me3 and H3K4me3 ChIP-seq tracks for Gata6 promoter (left); Bmp2 promoter (middle); and the HoxA cluster (right) show that H3K27me3 levels change (increase, decrease, or stay the same, depending upon locus) in Suz12GT cells upon differentiation. H3K4me3 levels change similarly in Suz12GT and wild-type cells over differentiation, but at lower levels in Suz12GT. (F) ChIP-qPCR data confirm that Suz12GT cells are capable of gaining significant H3K27me3 at Lhx9 and Inhbb, the two genes that gain the most H3K27me3 over differentiation in wt cells according to the ChIP-Seq data, whereas Eednull cells show no gain in H3K27me3 at these genes. Error bars represent standard deviation of three technical replicates. P-values were calculated with a Student’s two-sided t-test. *: p<5E-10; **: p<5E-15.

