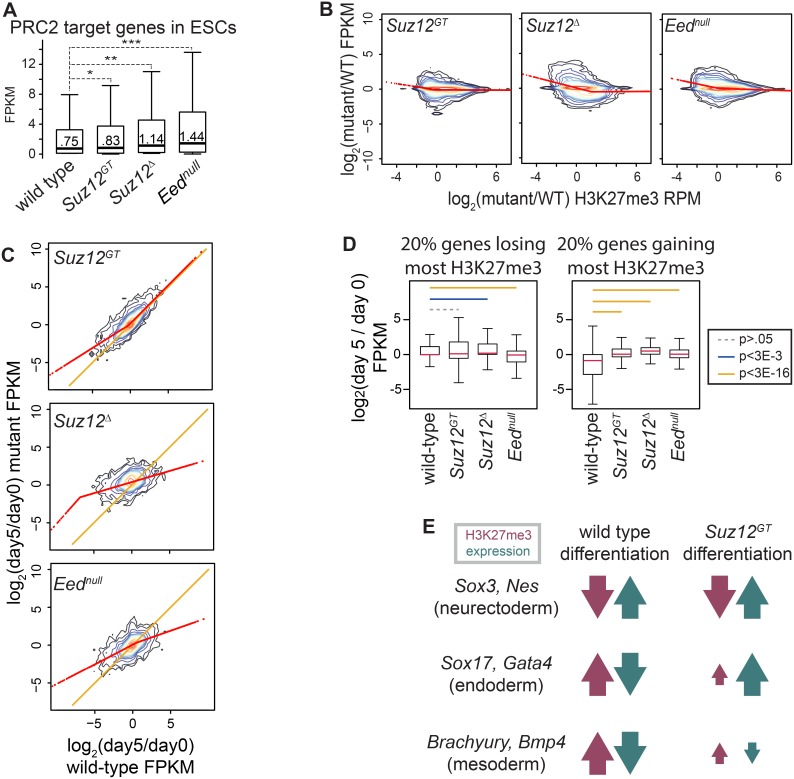
Figure 3. Proper H3K27me3 levels are necessary for coordinating developmental gene expression programs.
(A) RNA-seq of wild-type (wt), Suz12GT, Suz12Δ, and Eednull ESCs. Distributions of FPKMs of PRC2 target genes are shown as box and whisker plots that extend from the 25th to 75th percentile; whiskers represent 1.5x the length of the box. P-values were calculated with Student’s two-sided t-test. *: p<5E-2; **: p<5E-5; ***: p<5E-7. (B) RNA-seq and H3K27me3 ChIP-seq are shown for Suz12GT (left panel), Suz12Δ (middle panel), and Eednull (right panel) ESCs with respect to wt. Kernel densities of the data are represented along 14 levels. A segmented regression method was used to calculate localized best-fit and is plotted in red. (C) RNA-seq of wt, Suz12GT, Suz12Δ, and Eednull ESCs and day 5 SMNs. y-axis shows log2 of the ratio of FPKM in differentiated: ESC in mutant lines as indicated; x-axis represents this ratio in wt cells. Kernel densities of the data are represented along 14 levels. Segmented regression on the data is plotted in red and the y = x line in orange. (D) Relationship between change in H3K27me3 and expression over differentiation is shown as box plots. All genes were binned by change in H3K27me3 levels over differentiation in each respective cell type (log2 of H3K27me3 (day 5/day 0)). y-axis shows distribution of change in expression (log2 of FPKM (day 5/day 0)). Left panel: bottom quintile in each cell type. Right panel: top quintile in each cell type. P-values were calculated using a Student’s t-test and are represented by colored lines between bins. (E) Change in H3K27me3 and expression over differentiation for representative genes. Gain or loss in H3K27me3 or expression is represented by upward or downward arrow, respectively, whereas magnitude is represented by size of arrow.

