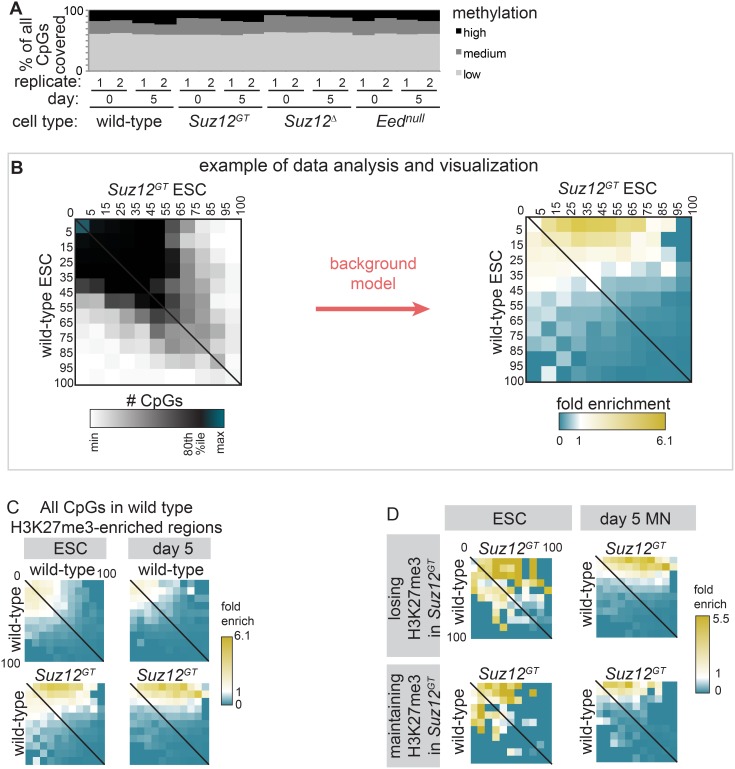
Figure 4. PRC2 is antagonistic to DNA methylation in cis.
Through RRBS, percent methylation at each CpG with ≥10-fold coverage was calculated in wild-type (wt), Suz12GT, Suz12Δ, and Eednull ESCs and day 5 differentiated cells. (A) Distribution of methylation at all CpGs is shown. Low: ≤15% methylated; high: ≥80%. (B) This panel is an explanatory example of the data analysis and visualizations used in Figures 4C–D, using the lower-left heatmap of 4C as an example. (left) CpGs were binned according to % methylation in wt (y-axis) and Suz12GT (x-axis) ESCs. Thus, the matrix displays the number of CpGs in each 2-D bin. The data is largely along the x = y line (CpGs with the same % methylation in Suz12GT as wild-type), shifting towards the top right (more methylation in Suz12GT). (right) Fold enrichment over the overall distribution of the data was determined for each bin using a replicate-based background model (see Methods). In this example, high statistical enrichment over background in Suz12GT cells (yellow) is visible for CpGs with little methylation in wt cells (C) CpGs in wt H3K27me3-enriched regions are used to analyze changes in DNA methylation in ESCs (left panel) and day 5 SMN (right panel). The enrichment in the lower heatmaps shows CpGs with low methylation in wt (y-axis) gaining methylation in Suz12GT (x-axis). (D) (Top) H3K27me3-enriched regions in wt ESCs that lose enrichment in Suz12GT. (Bottom) Regions maintaining H3K27me3 enrichment in Suz12GT ESCs. Regions losing H3K27me3 in Suz12GT cells gain overall more DNA methylation than those maintaining significant H3K27me3.

