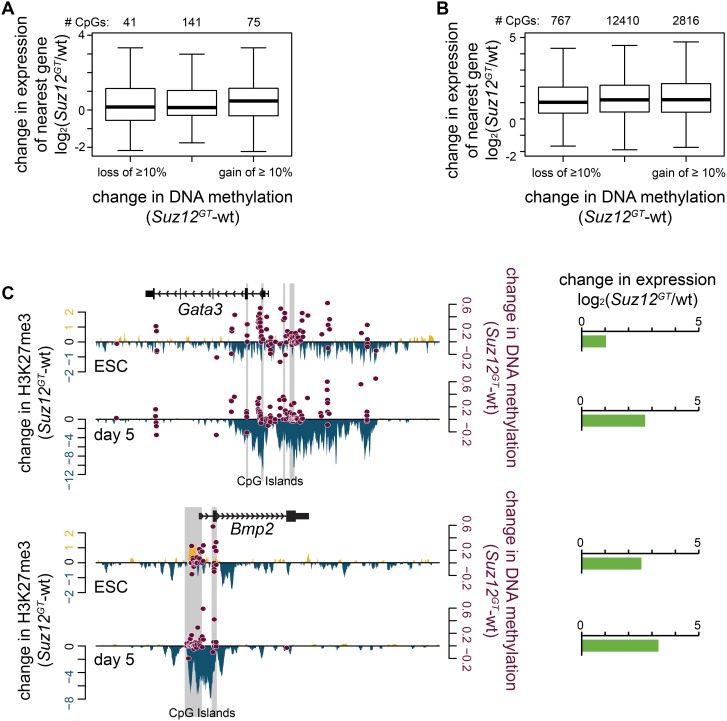
Figure 5. Increased DNA methylation upon loss of PRC2 does not lead to target gene repression.
(A) Regions with significantly enriched H3K27me3 in wild-type (wt) ESCs were considered. All CpGs in these regions with 10x coverage via RRBS in both wt and Suz12GT ESCs, and ≥.1 FPKM in at least one of these cell types, were used in the analysis. Of these 257 CpGs, 41 lose ≥10% DNA methylation, 75 gain ≥10% DNA methylation, and 141 do not change. The distribution of change in expression in Suz12GT ESCs with respect to wt ESCs of the genes associated with these CpGs is plotted on the y-axis. No association between change in DNA methylation and gene expression is observed. (B) Same as in (A) except in day 5 SMNs. Of these 15993 CpGs, 767 lose ≥10% DNA methylation, 2816 gain ≥10% DNA methylation, and 12410 do not change. The distribution of change in expression in Suz12GT cells with respect to wt cells of the genes associated with these CpGs is plotted on the y-axis. No association between change in DNA methylation and gene expression is observed. (C) Two example genes, Gata3 and Bmp2, are shown here. Change in H3K27me3 signal between wt and Suz12GT cells is plotted on the left y-axis; gain in Suz12GT is shown in yellow, and loss is shown in blue. Change in DNA methylation for each CpG with 10x coverage in both cell types is plotted in maroon on the right y-axis. Change in gene expression (log2 of the ratio of the FPKMs (Suz12GT/wt)) is shown in horizontal bar graphs to the right of the panel.

