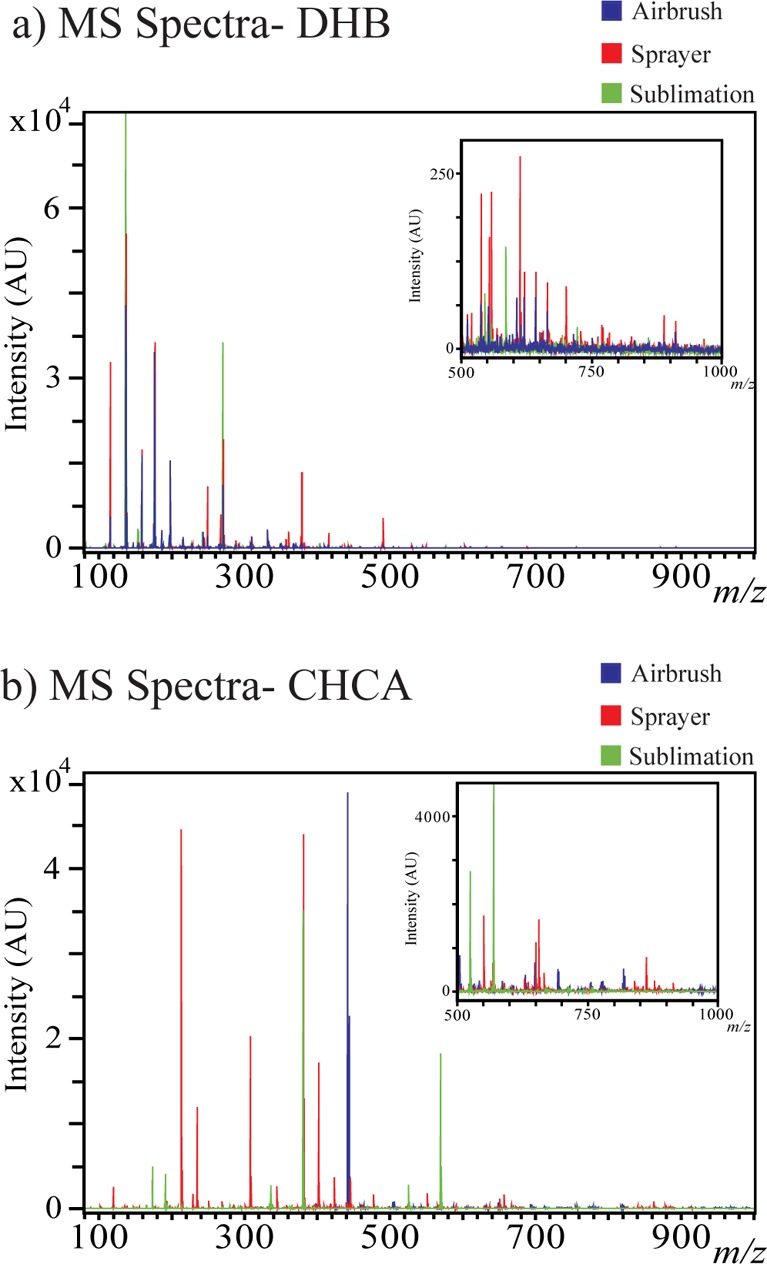
Figure 2.

MS profiles of pure (a) DHB and (b) CHCA matrix peaks (with no sample) when applied to a glass slide with the airbrush (blue), optimized automatic sprayer (red), and the optimized sublimation (green) matrix application methods. Inlays show the MS spectra zoomed in to the higher m/z range (m/z 500–1000).
