
Figure 2.
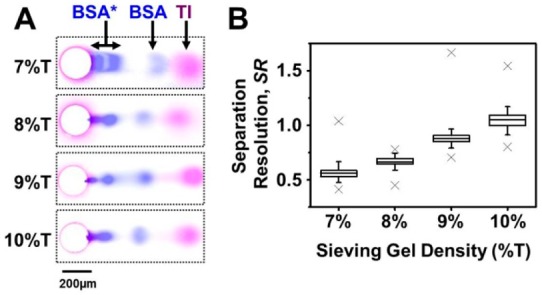
Microscale PAGE performance improves with smaller PA gel pore size. (A) False-color fluorescence micrographs of a 1 mm long PAGE separation distance for a range of PA gel densities. A purified fluorescently labeled two-component protein standard was used: TI (magenta signal) and BSA (blue signal). PAGE was halted when the fastest standard species reached the separation axis terminus (21 s, 7%T; 20 s, 8%T; 23 s, 9%T; 26 s 10%T). Highlighted circular features indicate 30 μm diameter microwells. (B) SR improves as gel pore size is reduced. Box ends indicate 25th and 75th quantiles; line at box middle indicates median value; whiskers extend to 95% confidence limits; and outliers marked with “×”. SR in the 10%T PA gel was significantly higher than that at 9%T PA gel (t test, two tailed, p-value = 2.72 × 10⁻²⁰). E = 40 V cm–1.