
Figure 3.
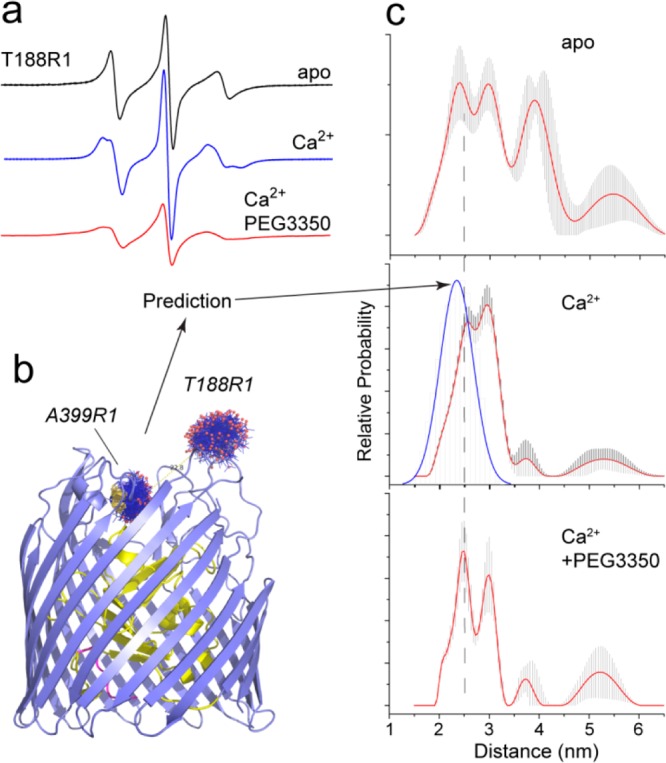
Conformational heterogeneity in the extracellular ligand binding loops of BtuB. (a) X-band EPR spectra from T188R1, which is located in the second extracellular loop of BtuB, in the apo state and in the presence of calcium and calcium with the addition of 30% w/v PEG 3350.37 (b) Positions and allowable conformers of the R1 label at sites 399 and 188 in BtuB. Position 399 is in the barrel and does not exhibit changes in line shape with substrate or PEG addition. The label conformers and the expected distance distribution (blue trace in part c, second panel) were calculated using the PYMOL plug-in MTSSL Wizard,38 which takes into account steric constraints imposed by the structure but does not otherwise bias label conformers based upon torsional potentials or experimentally populated rotamer states.53 (c) Distance distributions obtained by DEER between 399R1 and 188R1 in the apo state, in the presence of Ca2+, and in the presence of Ca2+ with 30% w/v PEG 3350 (top to bottom, respectively).37 The expected distance distribution in the Ca2+-bound state based upon the corresponding crystal structure PDB ID 1NQG is shown (blue trace, center panel). The error bars in the distribution represent fits that have an RMSD within 15% of the best solution. All DEER data were analyzed with the software package DeerAnalysis.54