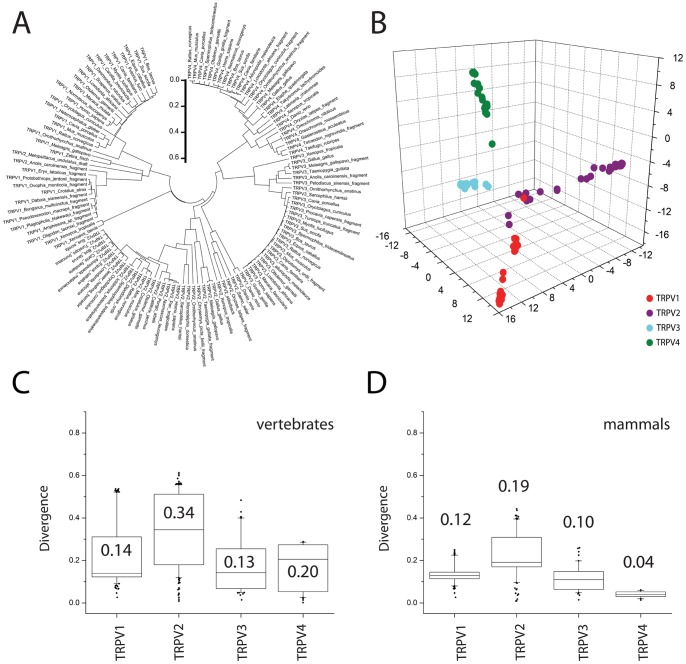
Figure 1. TRPVs phylogeny.
A. Radial phylogenetic tree for TRPVs. The scale bar indicates evolutionary time in arbitrary units. B. Clustering by PCA analysis for TRPVs. Attending to their evolutive distances TRPV1-4 could be clustered into 4 subgroups corresponding to each of the four channels. C. Sequence divergence profile for vertebrate TRPVs. D. Sequence divergence profile for mammalian TRPVs. The box plots represent the divergence of sequences distribution for each channel. The median value is indicated for each box plot. Refer to the text for specific statistical comparison of the medians.

