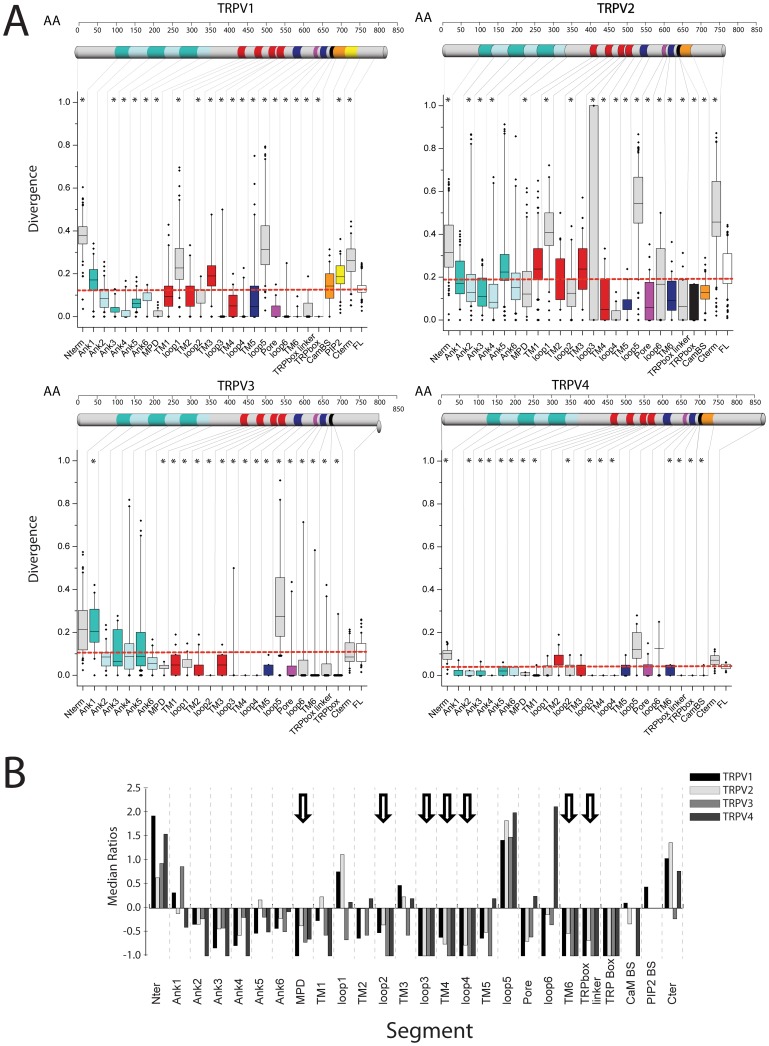
Figure 2. Domain-specific conservation profile for TRPV channels.
A. Box plots showing the sequence divergence for specific domains of TRPV1-4 channels. The domain topology for the channels is indicated as a cartoon bar. The color-coding for each domain in the cartoon bar is represented in the box plot coloring. B. Plot of the normalized ratio for the medians for each domain segment. The Y-axis indicates the conservation (negative values) or divergence (positive values) of the domain in respect to the full-length protein conservation (value 0).

