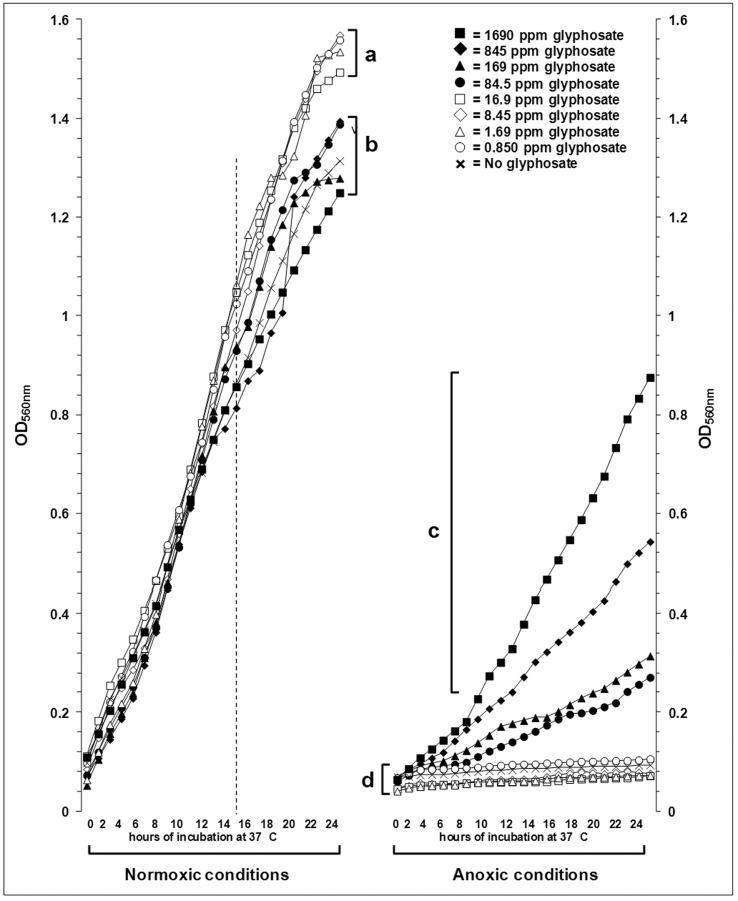
Figure 1.
Growth of P. aeruginosa ATCC®15442 in different concentrations of glyphosate and normoxic/anoxic conditions. Each point represents the arithmetical average of nine repetitions. Brackets arbitrarily group the final growths (i.e. after 24 h) which present some quantitative similarity or that got apart from a compact cluster (for 84.5 ppm to 1690 ppm glyphosate in anoxic conditions).

