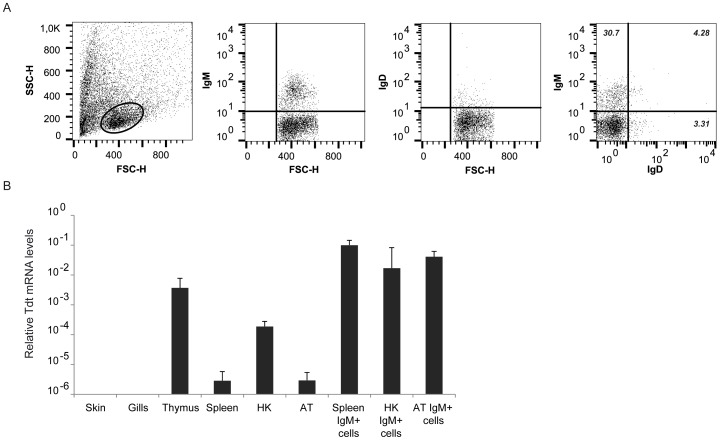
Figure 3. Characterization of IgM+ cells in rainbow trout AT.
(A) The presence of IgD and IgM B cell subsets in the AT was analyzed through a double staining with anti-IgM coupled to Alexa 555 together with IgD coupled to Alexa 647. The left panel shows the FSC/SSC profile including the leukocyte gate, followed by plots showing IgM and IgD fluorescence intensity in single stained samples, and IgM and IgD fluorescence intensity in double labeled samples. Data shown correspond to a single representative fish of 6 individualized fish analyzed. (B) TdT transcription levels in different tissue and sorted IgM+ populations from different sources. Data are shown as the mean gene expression relative to the expression of an endogenous control (EF-1α) ± SD (n = 5).

