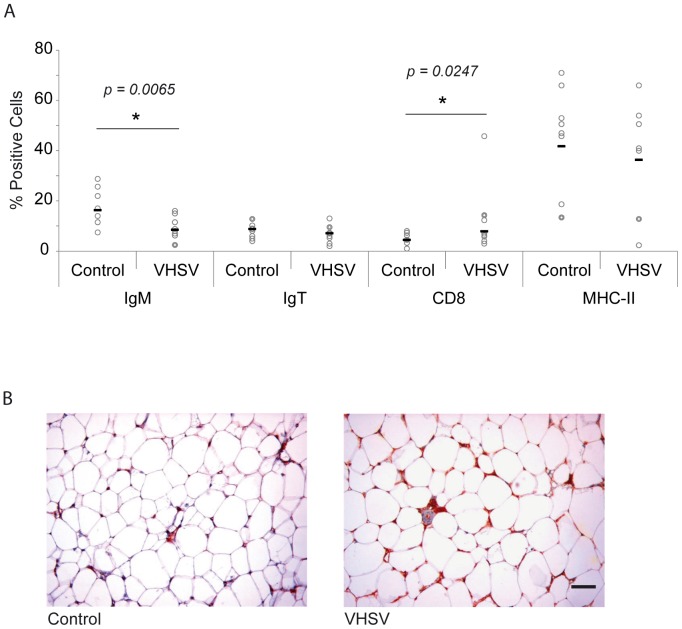
Figure 8. Distribution of leukocyte populations in the AT after VHSV infection.
(A) The percentage of IgM+, IgT+, CD8+ and MHC-II+ cells was analyzed by flow cytometry in the AT of VHSV-infected and mock-infected fish at day 5 post-infection. Open circles represent number of cells in individual fish, whereas black bars represent mean values in each experimental group. Statistic differences between cell numbers in infected and mock-infected fish were determined using a Student t test. (B) Inmunohistochemical detection of trout IgM in AT from VHSV-infected and control mock-infected fish. Bar represents 50 µm.

