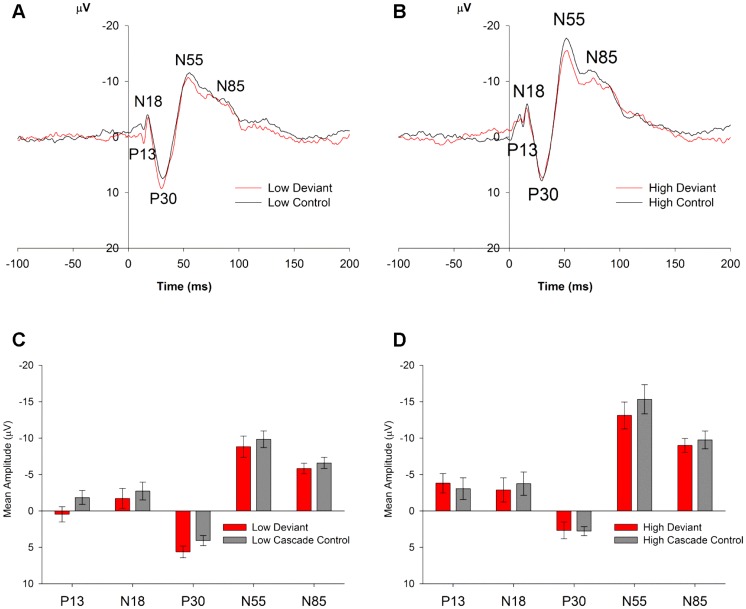
Figure 5. Rat ERPs in Study 3, averaged over all regions.
(A,B) ERPs (averaged over all five regions) to the oddball deviant (red) and the cascade control (black) for the low (A) and high (B) frequency stimuli. As in Study 2, all stimuli show a similar pattern with the same components (P13, N18, P30, N55 and N85), however in this case, responses to deviants were not larger in amplitude in comparison to the controls and the standards. (C,D) Mean amplitudes (± standard error, SE) of P13, N18, P30, N55 and N85 generated by oddball deviants (red) and the cascade controls (grey), averaged over all five regions.

