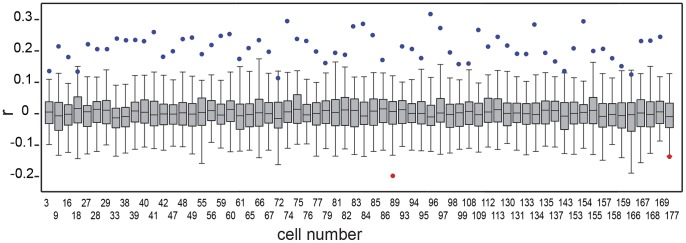
Figure 3. Analysis of the chance of significant correlations being spurious.

Comparison between the box plots of the distribution of correlation coefficients between synthetic seasonally detrended chlorophyll time series and seasonally detrended dust deposition model outputs (N = 100) and the actual observed correlation between the seasonally detrended chlorophyll and the seasonally detrended dust deposition model outputs (dots). Data is shown only for those cells showing significant (p<0.05) observed correlations. Dots in blue represent significantly positive correlations and red significantly negative correlations. Box plots show the median, the grey box englobing all data between the 25 and 75 percentiles, and the range between the smallest and largest values that are not outliers. Starting from the detrended data of the cells that show statistically significant correlations between detrended chlorophyll and deposition (Fig. 1b), synthetic Chl time series with the same mean and standard deviation (normal distribution) as the original detrended chlorophyll time series, were computed for each cell. The correlation between these synthetic Chl time series and the modelled dust deposition were computed. For each cell, this process was repeated 100 times, and the probability distribution functions (PDFs) of the correlations were then obtained and presented as box plots.
