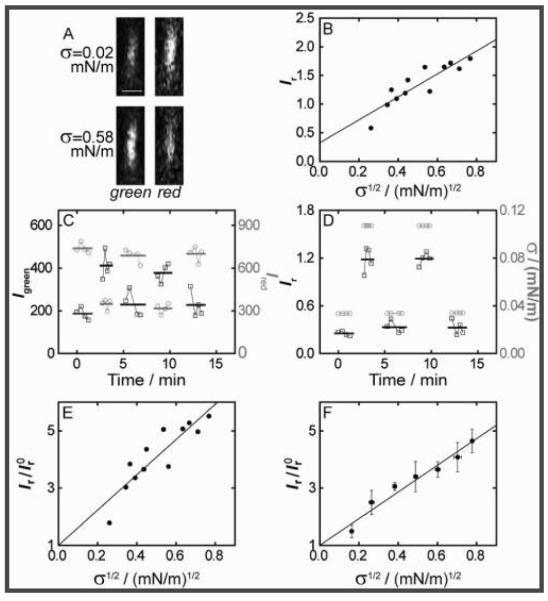
Figure 2.
Curvature dependence of ENTH membrane localization. (A) Demonstration of Kalman-averaged confocal xz line-scan images (obtained near the tether base) used to monitor ENTH-GFP binding under varying tension. Bar: 1 μm. (B) Plot of the ratio of green and red channel fluorescence intensities (Ir) Igreen/Ired) from images typified in (A) (see the SI) as a function of the square root of membrane tension for an individual tether, revealing a linear relationship. The line shows a linear fit with intercept I r0) 0.33 ± 0.17. (C) Demonstration of reversibility and equilibration under the conditions as used in (A) and (B). Green and red intensities for two cyclic tension changes [tension values in (D)]. Left axis, black squares, Igreen; right axis, gray circles, Ired. Bold lines indicate average fluorescence values from four images for each σ. (D) Ir values for the data in (C) (left axis, black squares), with indicated tension levels (right, gray circles). (E) Ir values from (B) were normalized to I r0 and fitted using eq 1 (see the SI), yielding Λ = −169 ± 4 pN (the uncertainty is from linear regression). (F) Data from seven vesicles processed as demonstrated in (B) and (E) were binned (error bars represent standard errors of the mean) and fitted with eq 1, yielding Λ = −146 ± 3 pN (uncertainty from regression).

