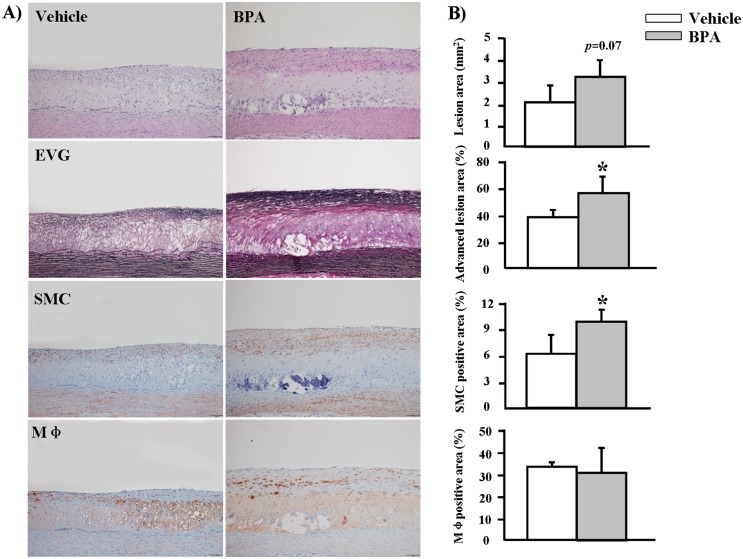
Figure 5. Microscopic analysis of atherosclerosis in the aortic arches of WHHL rabbits at 12 weeks.
(A) Representative micrographs stained with H&E and EVG for intimal lesion analysis are shown in the top two panels. Representative micrographs stained with HHF35 and RAM11 mAbs for immunohistochemical analysis of SMCs and macrophages are shown in the lower two panels. (B) Intimal lesions, advanced lesions, SMCs and Mφ-positive areas of the sections were quantified using an image analysis system as described in the Materials and Methods section. Data are expressed as the means ± SD, n = 6 for each group. *p<0.05 vs. vehicle. Original magnification: 10×.

