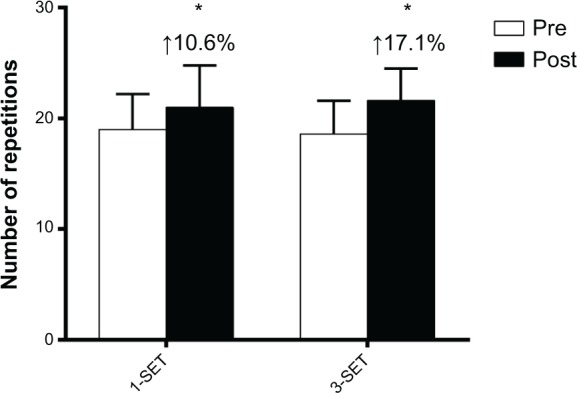
Figure 4.

Functional performance in the sit-to-stand test before and after 24 sessions of resistance training.
Notes: Data are presented as means ± standard deviation. Percent differences between pre-test and post-test. *P<0.05, versus pre-test.
Abbreviations: 1-SET, single set; 3-SET, three sets.
