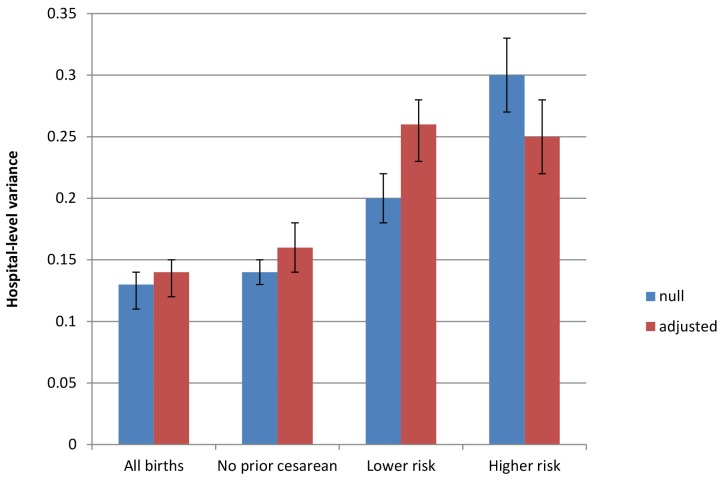
Figure 2. Between-hospital variation in cesarean deliveries overall and for subgroups of women, null and fully adjusted models.
Populations include all births, all births to women with no prior cesarean delivery, all births to lower risk women (those with term, singleton, vertex pregnancies and no prior cesarean delivery), and all births to higher risk women (those with a preterm, multiple gestation, or nonvertex pregnancy or prior cesarean delivery). Factors included in adjusted models are diagnosis of maternal hypertension, diabetes, hemorrhage or placental complications, fetal distress, and fetal disproportion or obstructed labor; maternal age, race/ethnicity, and insurance status; hospital bed size and location/teaching status; and state-level fixed effects.

