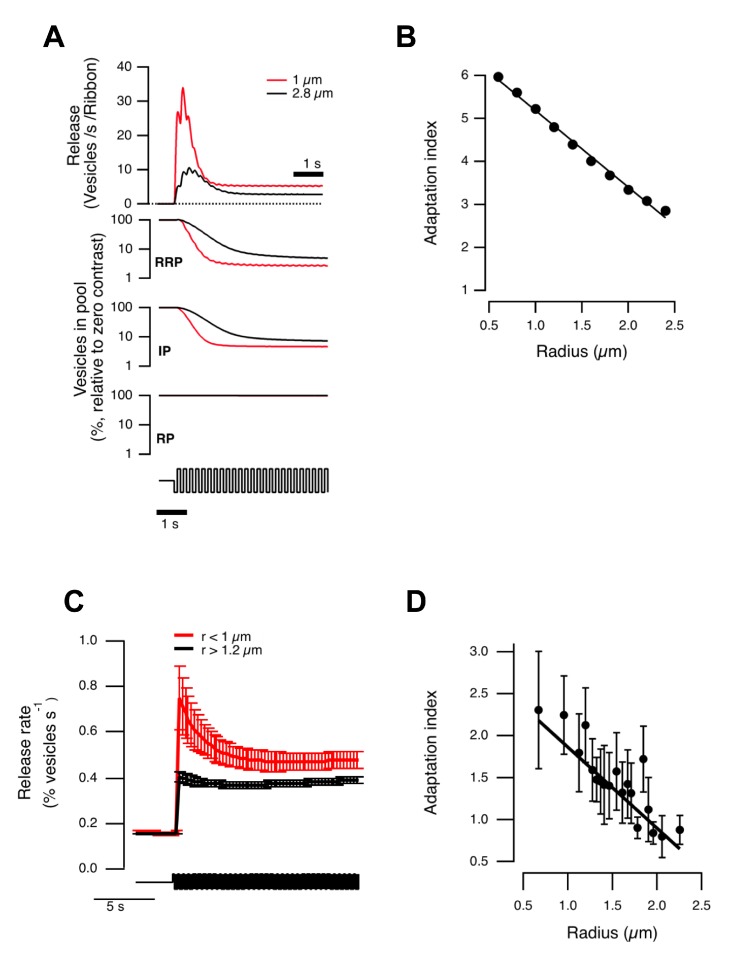
Figure 6. Contrast adaptation depends on terminal size: comparison of model and experiment.
(A) Top, vesicle release modeled in small (red) and large (black) terminals in response to a 5 Hz stimulus (100% contrast). Small terminals are predicted to exhibit stronger adaptation. Bottom, dynamics of three vesicle pools used in the model. RRP and IP deplete faster in small terminals while RP in small and large terminals remains near constant. (B) Modeled adaptation index (Methods) decreases linearly with terminal radius. (C) Adaptation of synaptic output measured in vivo was more profound in smaller terminals. Graph shows release dynamics of OFF terminals with r<1 µm (red) and r>1.2 µm (black) in response to a 5 Hz stimulus (cf. (A)). (D) Adaptation index decreases linearly with terminal radius, as predicted by the model (n = 236 OFF terminals from seven fish, each bin is an average of 12 individual terminals). Spearman correlation = −0.86, critical value (p = 0.05) = 0.45. See also Figure S5.

