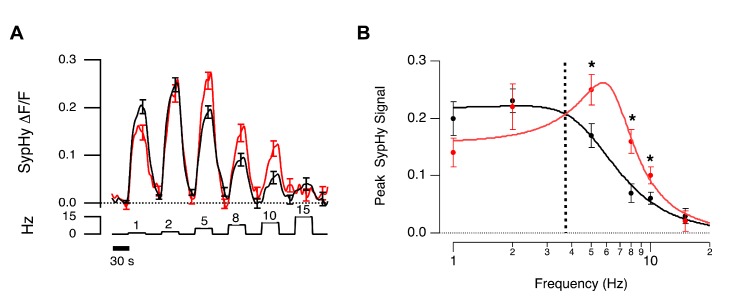
Figure 8. Frequency tuning of BCs with different terminal size.
(A) Mean sypHy fluorescence signals in OFF terminals in response to full-field stimuli of different temporal frequencies measured in vivo (red, rsmall<1 µm, n = 10; black, rlarge>1.5 µm, n = 32). (B) Synaptic gain of large (black) and small (red) terminals as a function of stimulus frequency. Results are described by the function For large terminals, A = 0.22±0.02, fo = 4.96±0.45, Q = 0.78±0.17. For small terminals A = 0.16±0.02, fo = 6.43±0.27, Q = 1.57±0.37. Asterisks mark significantly different responses at a given frequency, as evaluated by Mann-Whitney U test (p<0.05).

