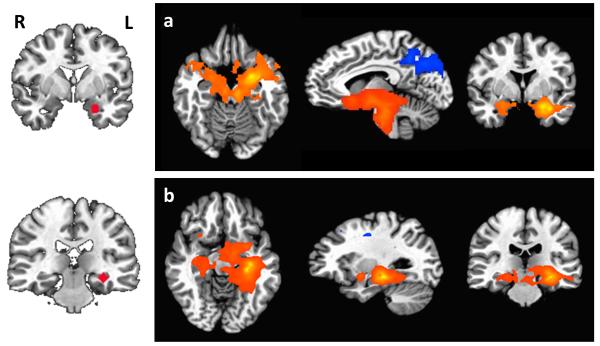
Figure 1.
Functional connectivity maps showing regions that are significantly connected to a) left amygdala, and b) left hippocampus. Seed regions are shown on the left, with connectivity maps on the right. Connectivity maps for the right amygdala and hippocampus showed similar patterns. Positive connectivity is indicated by orange-yellow overlays, and negative connectivity by blue overlays. For axial and coronal views, the right side of the brain faces left. Maps are displayed at voxelwise p≤0.005.

