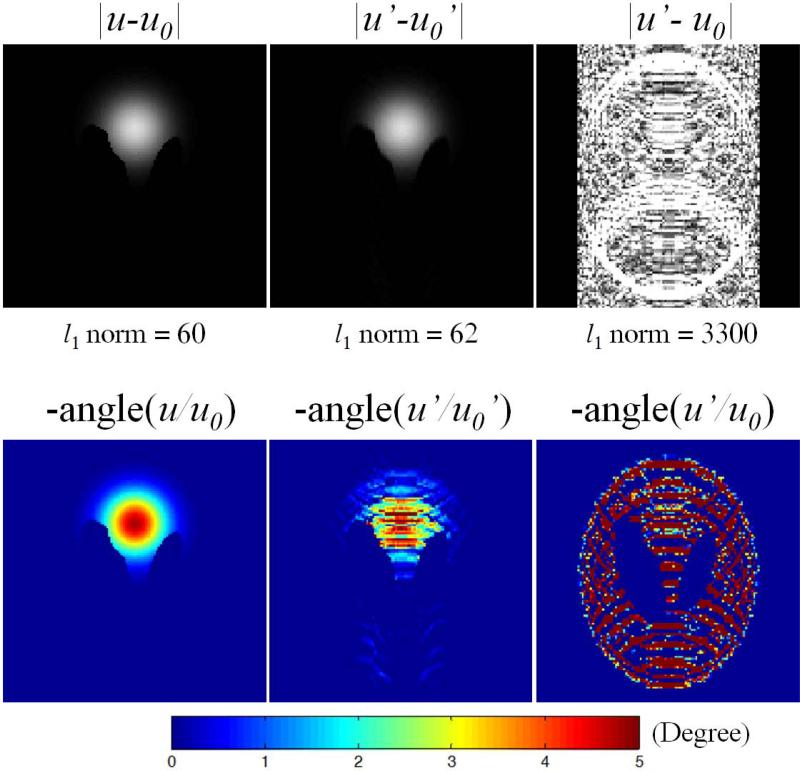
Figure 2.
Complex difference magnitude (top row) and phase difference (bottom row) of the baseline (u0) and post-heating (u) images by simulation. Undersampled images are denoted with ′. The l1 norms of each magnitude images are listed, with 3% increase from {u-u0} to {u′-u0′}, compared to 15% increase from u to u′ (not shown). All magnitude images are shown on the same color scale.

