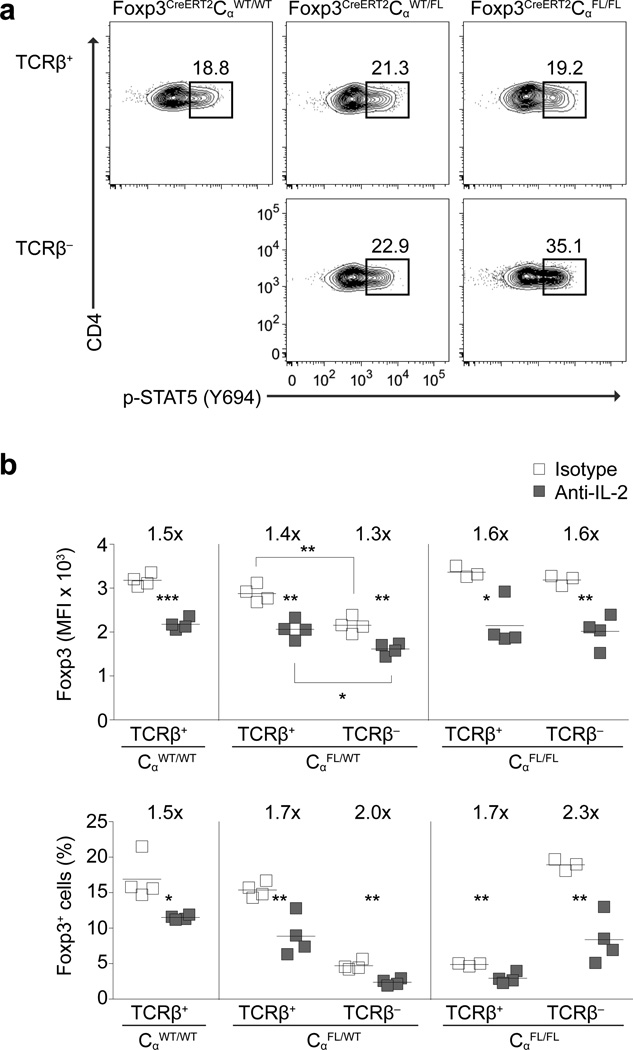
Figure 4. Treg cell TCR expression is dispensable for IL-2R signaling in vivo.
(a) p-Stat5 expression in lymph node TCRβ+ and TCRβ− CD4+Foxp3+ cells in Foxp3CreERT2CαWT/WT, Foxp3CreERT2CαFL/WT and Foxp3CreERT2CαFL/FL mice on day 9 following tamoxifen administration on days 0 and 1. Data is representative of three experiments with three or more mice per group in total. (b) Foxp3 median fluorescence intensity (MFI) in TCRβ+ and TCRβ− Foxp3+ cells (upper panel) and percentages of TCRβ+ and TCRβ− Foxp3+ cells among CD4+ cells (lower panel) in lymph nodes of Foxp3CreERT2CαWT/WT, Foxp3CreERT2CαFL/WT and Foxp3CreERT2CαFL/FL mice on day 13 following tamoxifen treatment on days 0, 3, 7 and 10 and i.p. injections of IL-2 neutralizing or isotype antibody on days 4 and 8. The data in (b) is representative of two experiments with two or more mice per group each. ***, P < 0.001; **, P < 0.01; *, P < 0.05. P-values were calculated using an unpaired t-test.

