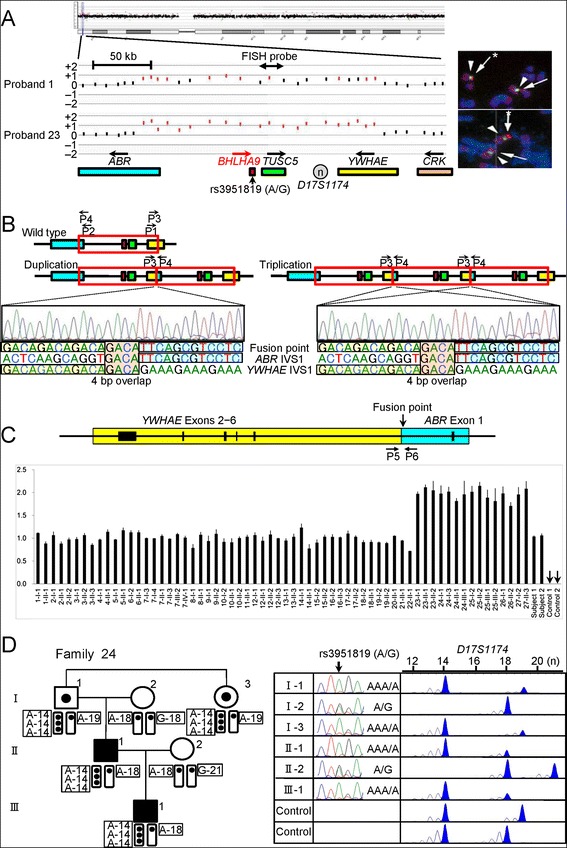
Figure 2.

Identification and characterization of the duplications/triplications involving BHLHA9 at chromosome 17p13.3. A. Array CGH and FISH analyses in proband 1 and proband 23 with GWC. In array CGH analysis, the black and the red dots denote the normal and the increased copy numbers, respectively. Since the log2 signal ratios for a ~200 kb region encompassing BHLHA9 are around +0.5 in the proband 1 and around +1.0 in the proband 23, this indicates the presence of three and four copies of this region in the two probands, respectively. In FISH analysis, two red signals with an apparently different density are detected by the 8,289 bp PCR probe (the stronger signals are indicated with asterisks). The green signals derive from an internal control probe (CEP17). The arrows on the genes show transcriptional directions. Rs3951819 (A/G) resides within BHLHA9. B. Determination of the fusion point. The fusion has occurred between intron 1 of ABR and intron 1 of YWHAE, and is associated with a 4 bp (GACA) microhomology. P1–P4 show the position of primers. C. Quantitative real-time PCR analysis. The upper part denotes the fusion point. P5 & P6 show the position of primers. The lower part shows the copy number of the fusion point in patients/subjects with duplications/triplications (indicated by a family-generation-individual style corresponding to that in Figure 1 and Additional file 5). Subject-1 and subject-2 denote the two control subjects with the duplication, and control-1 and control-2 represent normal subjects without the duplication/triplication. D. The rs3951819 (A/G SNP)–D17S1174 (CA repeat number) haplotype patterns in family 24. Assuming no recombination between rs3951819 and D17S1174, the haplotype patterns of the family members are determined as shown here. The haplotype patterns of the remaining families have been interpreted similarly.
