Figure 4.

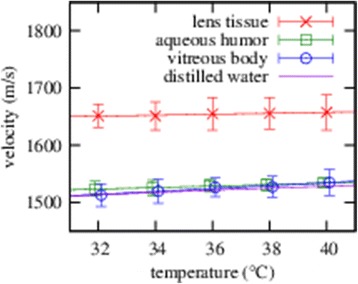
Ultrasound velocity in the equine aqueous, vitreous and lens tissue is depicted, averaged over all three sample groups, depending on the temperature of the sample.

Ultrasound velocity in the equine aqueous, vitreous and lens tissue is depicted, averaged over all three sample groups, depending on the temperature of the sample.