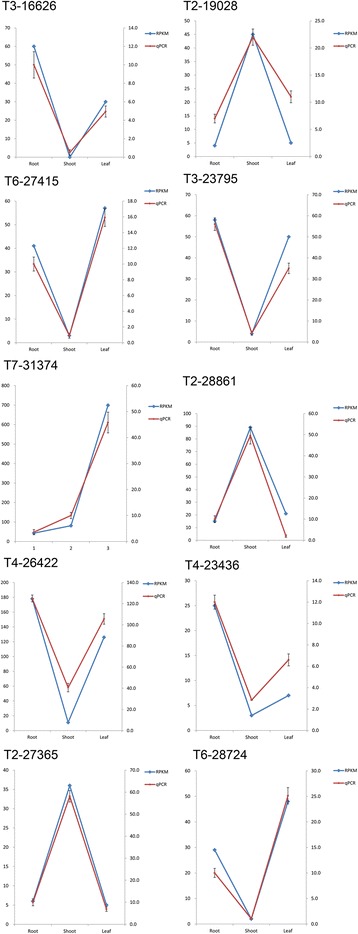
Figure 5.

The expression profile of ten selected TFs validated by qPCR. The left axis represents the results of transcriptomics analysis while the right axis represents relative expression detected by qPCR, and the error bars represented the standard deviation (S.D.) values for three independent experiments, performed in triplicate.
