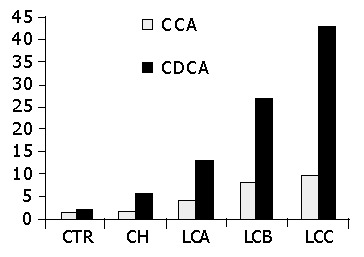
Figure 2.

Serum levels of cholic acid (CCA) and chenodeoxycholic acid (CDCA) conjugates. CTR = controls; CH = chronic hepatitis; LCA = liver cirrhosis Child A; LCB = liver cirrhosis Child B; LCC = liver cirrhosis Child C. aP<0.05 vs CH, LCA, LCB, LCC bP<0.001 vs LCA, LCB, LCC dP<0.001 vs LCB, LCC.
