
Figure 2.
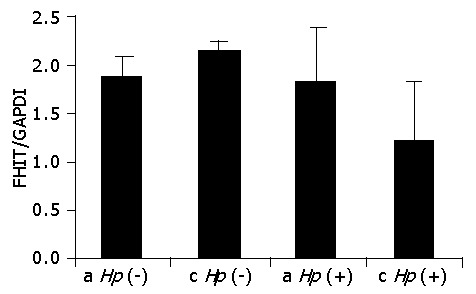
Comparison of FHIT expression in the gastric mucosa of group I patients (without family histories of cancer), with the topography of the biopsied specimens (a, antrum; c, corpus) and H pylori colonization (Hp(+)/Hp(-)). The mean ± SE values are marked.