
Figure 4.
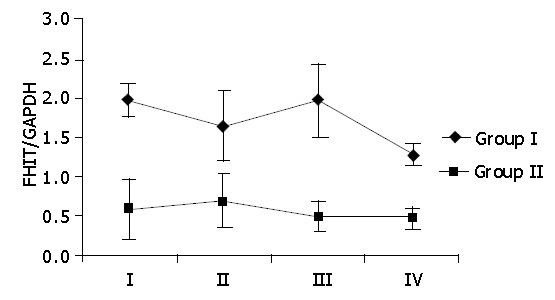
Comparison of the FHIT/GAPDH mean values for the patients of groups I and II and the macroscopic evaluation of the gastric mucosa on the Sydney scale. The FHIT/GAPDH mean values were calculated for all cases of each Sydney system group, independent of stomach topography and colonization with H pylori. The mean±SE values are marked.