
Figure 5.
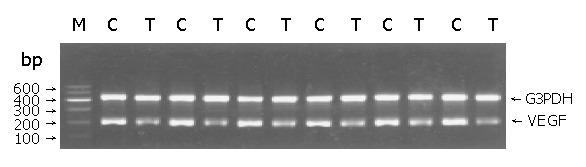
RT-PCR of VEGF mRNA in HCC tissue. M: Marker, 100 bp DNA ladder, ranging from 100 bp to 600 bp; C: Control group; T: Therapy group. The band of VEGF (all isoforms, 196 bp) and G3PDH (450 bp) are shown at expected location in the gel. G3PDH used as an internal standard. VEGF mRNA was expressed strongly in control group, whereas weakly in therapy group.