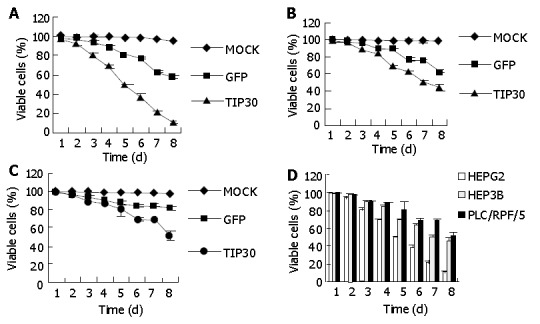
Figure 1.

Cell viability of hepatoblastoma cell lines: HepG2, Hep3B and PLC/RPF/5 on indicated days as measured by XTT assay following infection with Ad-TIP30 and GFP at MOI of 20 or treatment of PBS (mock) (A, B, C). Three cell lines were infected with TIP30 at MOI of 20 in 8 continuous days (D). Values in the figures are mean±SD.
