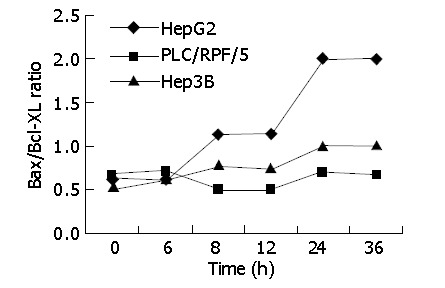
Figure 7.

Infection of Ad-TIP30 with immunoblot analysis: densitometric analysis of the bands. The cells were infected with Ad-TIP30 and mock (no virus) as control in HepG2, Hep3B and PLC/RF/5 cells. The variation of Bax/Bcl-xl ratio in the three cell lines with time course was shown.
