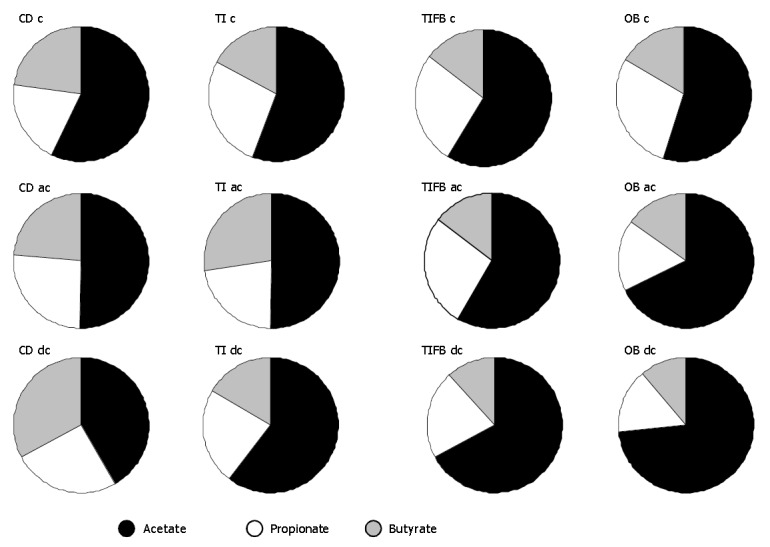
Figure 4.

Mean (%) of acetic, propionic and butyric acids in the mucosal contents of cecum (c), ascending colon (ac) and descending colon (dc) tissue segments isolated from mice of CD, TI, TIFB and OB groups. Results were drawn from the total mean(%) distribution of SCFAs throughout the experimental period (n = 6).
