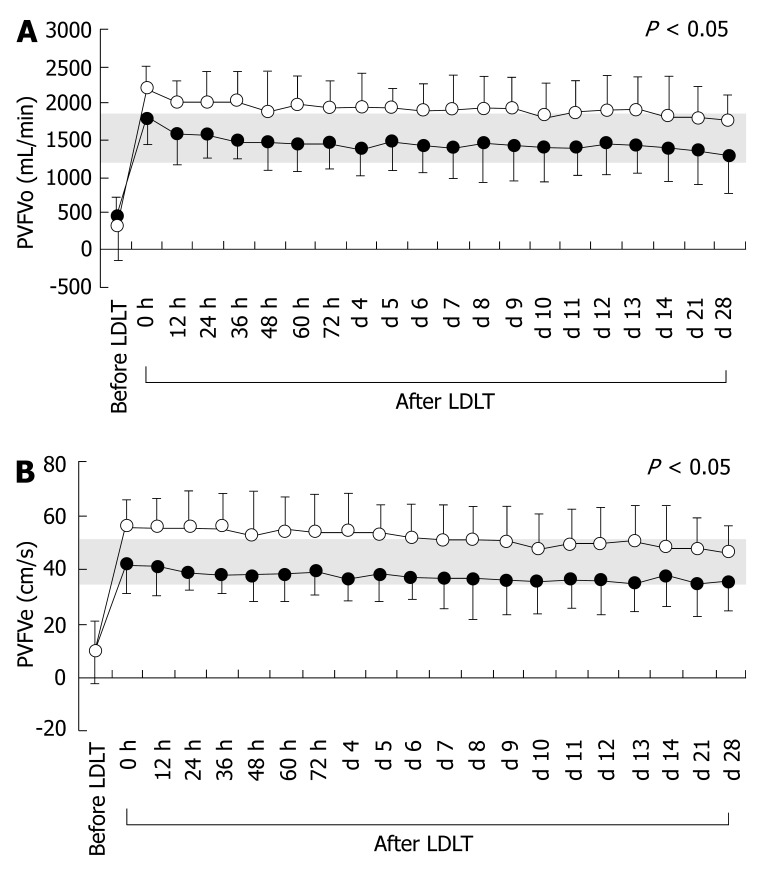
Figure 4.
Temporal changes in splanchnic circulatory parameters before and after LDLT. A: Temporal changes in PVFVo before and after LDLT; B: Temporal changes in PVFVe before and after LDLT. Open and closed circles represent splanchnic circulatory parameters for Groups I and II, respectively. Shaded areas show normal ranges measured in healthy individuals.

