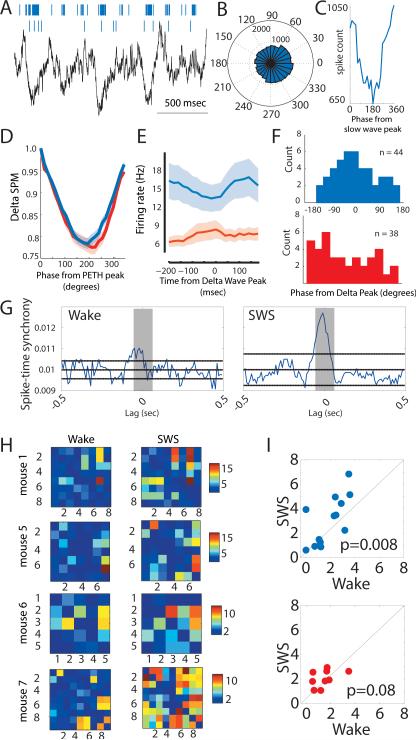
Figure 3. Enhanced synchrony of SC neurons during SWS.
(A) During SWS, SC neuronal spiking occurs near cortical slow wave troughs. (B-C) Spike delta phase-histogram of a SC neuron shows reduction of firing near the slow wave peaks. (D) As a population, SC neurons exhibit comparable delta phase-locking to AC neurons (shaded area denotes the group SEM), shown in the depth of their spike-phase modulation (SPM). (E) Delta wave peak-aligned PETH of the SC population (blue trace) shows stronger phase-alignment to cortical delta oscillations than the AC population (red trace). Shaded area is SEM. (F) Finding in E is further supported by plotting the histogram of the phase values (relative to delta wave peak) at which significantly modulated neurons exhibit minimum spike count. These distributions are significantly different (two-sample Kolmogorov-Smirnov test, P < 0.03). Note the peak in the SC neurons histogram, showing that these neurons exhibit little spiking around the peaks of delta oscillations. (G) Example of spike-time synchrony between two SC neurons (shaded area: [−50, 50] ms centered at zero lag) showing increased synchrony in SWS. (H) Spike-time synchrony (converted to Z-score related to baseline) seen at the ensemble level (examples from four mice). Note the consistent overall elevation of spike-time synchrony among SC units (mouse 1: n=8; mouse 5: n=7; mouse 6: n=5; mouse 7: n=9) during SWS compared to wakefulness. (I) Group analysis of these ensembles (SC: n = 13 ensembles from 4 mice, upper panel; AC: n = 9 ensembles from 4 mice, lower panel) shows an increase in SC sub-network synchrony during SWS. Color bar: Z-score. P-values: signed-rank test. See also Fig. S3.

