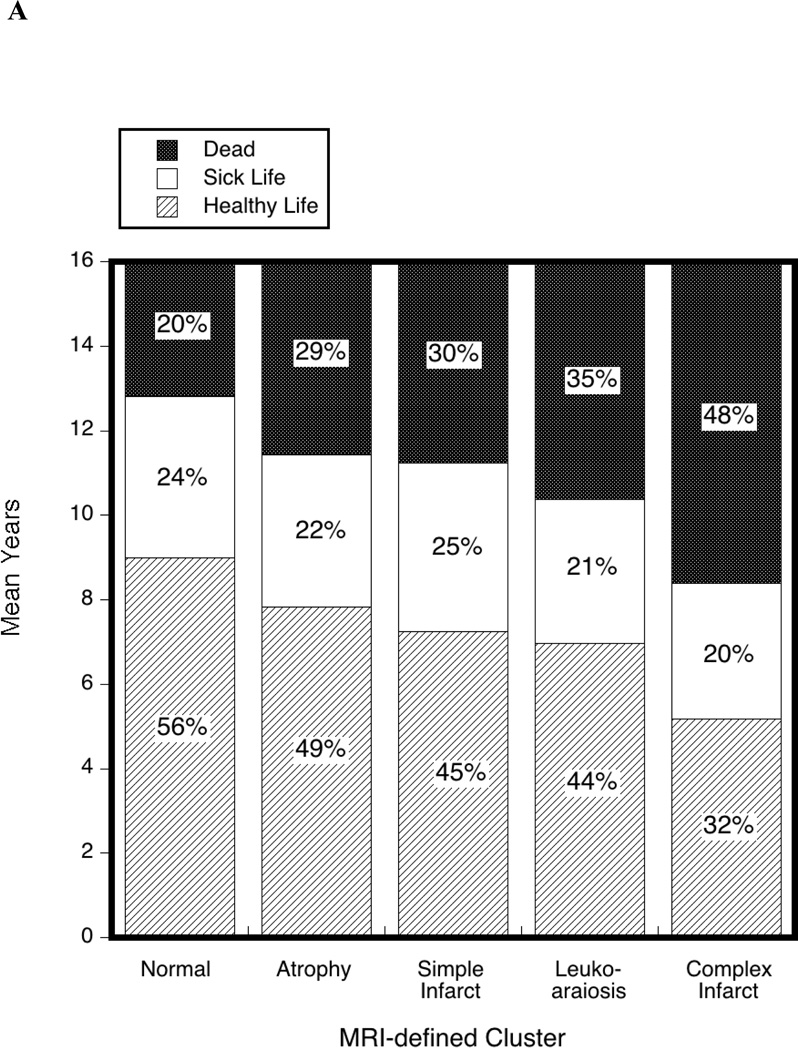
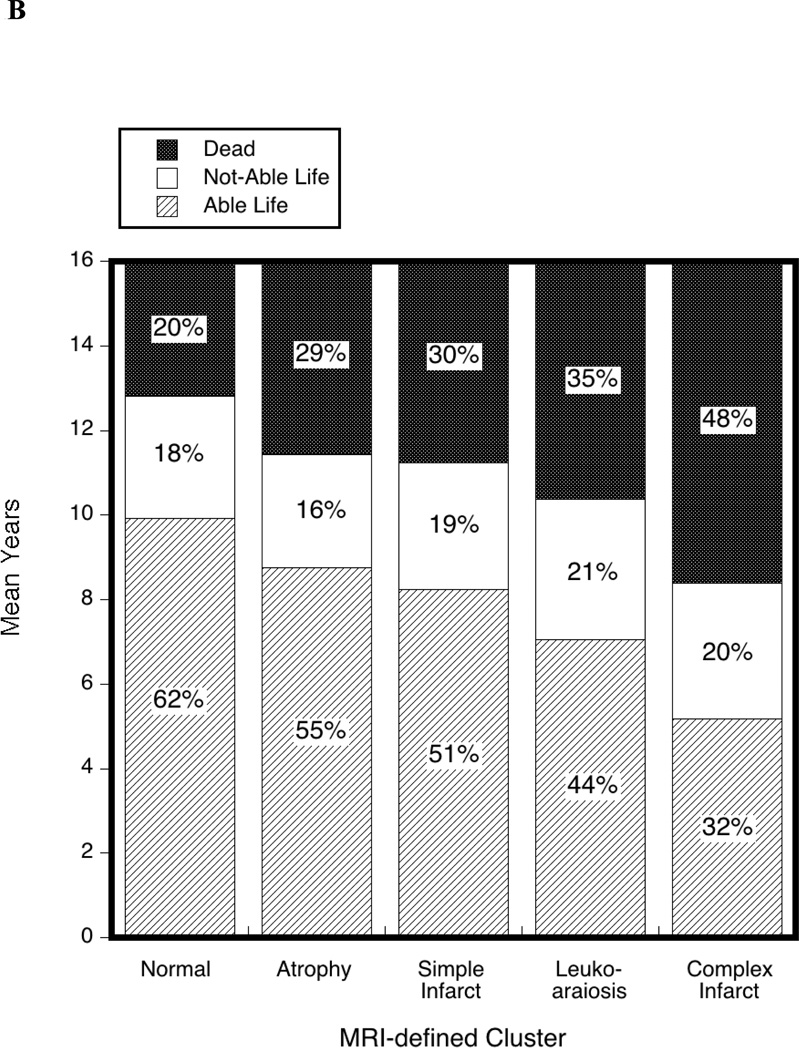
Figure 1. Distribution of healthy years (A)and able years (B) by the five MRI clusters.
Distribution of healthy years (A) and able years (B)in the 16 years following the MRI scan used to define the five clusters. Parts of columns representing years of healthy life (YHL) and years of able life (YAL) are lightly stripped; years of sick life (YSL) and years of not-able life (YNAL) are white; and years dead are darkly stippled. Percentages for each cluster total 100.


