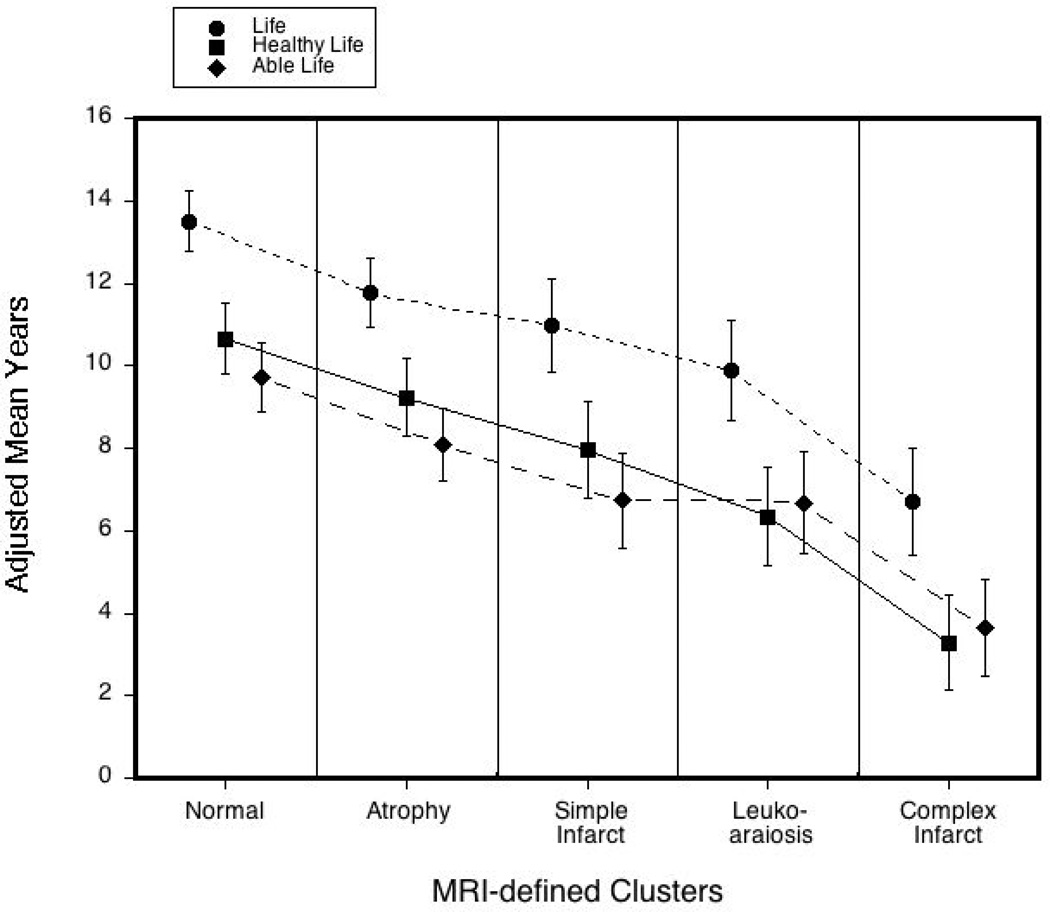
Figure 2. Adjusted years of life, healthy life, and able life.
Adjusted years of life (YoL), healthy life (YHL), and able life (YAL).Bars indicate99.5% confidence intervals to account for the multiple comparisons by the Bonferroni method, when age, sex and race are held the same for each of the five clusters. The short-dashed line is for YoL, the solid line is for YHL, and the long-dashed line is for YAL.

