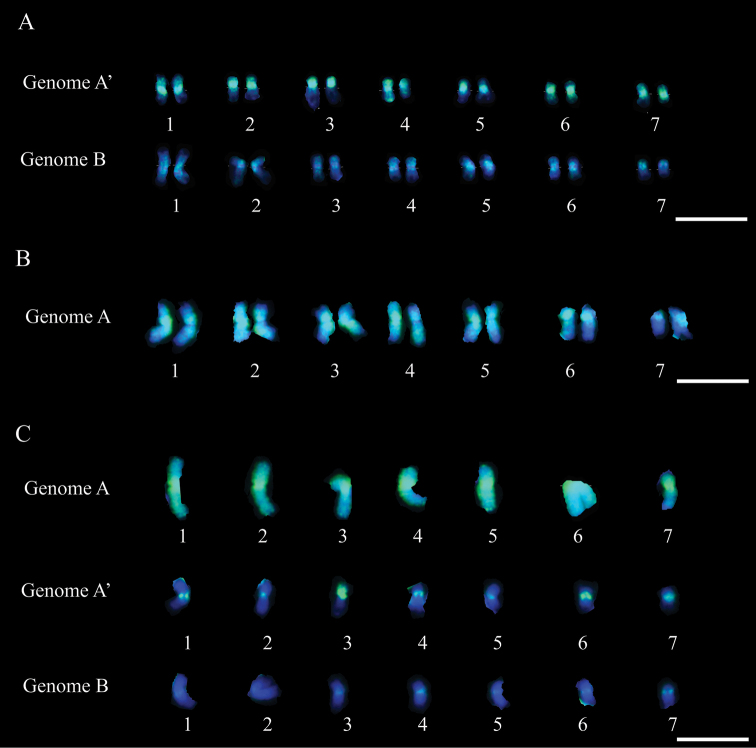
Figure 2.
Karyograms of Pennisetum purpureum (A), Pennisetum glaucum (B) and triploid hybrid (C) identifying the chromosomes of genomes A, A 'and B in each genotype. Note that in (A) using genome A probe (Pennisetum glaucum), the chromosomes of genome A’ were differed from chromosomes of genome B by the staining pattern. Genome A’ chromosomes showed more apparent probe markings in green than genome B chromosomes. In (B), using the genome A'B probe (Pennisetum purpureum), all chromosomes were strongly labelled (markings in green). In (C), using the genome A probe (Pennisetum glaucum), the chromosomes of the A genome were fully labeled by the probe (markings in green), the genome A’ were strongly marked in the centromeric region and the genome B, poorly marked. It also could be note the difference in the labeling pattern between the genome A probe on the chromosomes of genome A’ in interspecific hybrid and parental Pennisetum purpureum. Bar = 10 μm.

