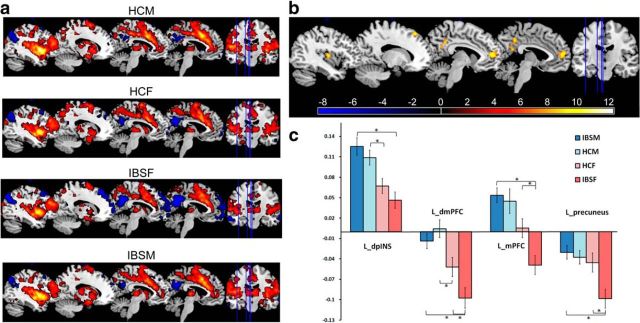
Figure 2.
Group differences in functional connectivity of the left dorsal anterior INS. a, Single-group connectivity maps of the left dorsal anterior INS. For display purposes only, all statistical results, thresholding at p < 0.005 uncorrected and cluster > 29 voxels, were overlapped on a MRIcron ch2better template. Red, Positive connectivity; blue, negative connectivity. b, Regions showed significant functional connectivity differences between groups (p < 0.05, corrected). c, Graph showed mean Z scores of significant regions connected with the left dorsal anterior INS for each group. * indicates significant difference after controlling for age, anxiety, and depression, p < 0.05, corrected. Error bars reflect SE. dmPFC, dorsal medial PFC; dpINS, dorsal posterior INS; HCF, HC females; HCM, HC males; IBSF, IBS female patients; IBSM, IBS male patients; L, left; mPFC, medial PFC.

