Figure 10.
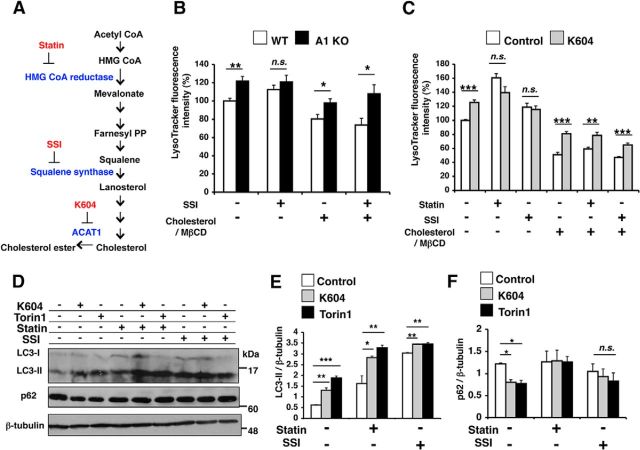
The effect of ACAT1 blockage on lysosome volume was sensitive to endogenous cholesterol biosynthesis. A, Cholesterol biosynthesis pathway and inhibitors used in this study and their target enzymes. B, WT or A1 KO microglia were incubated with 1 μm squalene synthase inhibitor (SSI) and/or 31.25 μm cholesterol in complex with 250 μm methyl-β-cyclodextrin (cholesterol/MbCD) for 24 h. LysoTracker-positive compartments were analyzed by LysoTracker staining (50 nm, 30 min) flow cytometry. Data are mean ± SEM of two experiments. *p < 0.05. **p < 0.01. n.s., Not significant. C, N9 cells were pretreated with the following agents: 50 μm lovastatin/230 μm mevalonate (statin) for 48 h, or 1 μm SSI for 24 h, or 31.25 μm cholesterol/MβCD for 48 h. Cells were then incubated with 0.5 μm K604 for 8 h in the presence of the same agents; 50 nm LysoTracker was added for the last 30 min of incubation. Fluorescence intensity was examined by flow cytometry. Data are mean ± SEM of three experiments. **p < 0.01. ***p < 0.001. n.s., Not significant. D–F, N9 cells were pretreated with 50 μm statin for 48 h or 1 μm SSI for 24 h. Cells were then incubated with 0.5 μm K604 for 8 h or 0.25 μm Torin1 for 3 h. Cell lysates were analyzed by Western blot for LC3 and p62. D, Representative blot. E, F, Data are mean ± SEM of three experiments. *p < 0.5. **p < 0.01. ***p < 0.001. n.s., Not significant.

