
Figure 5.
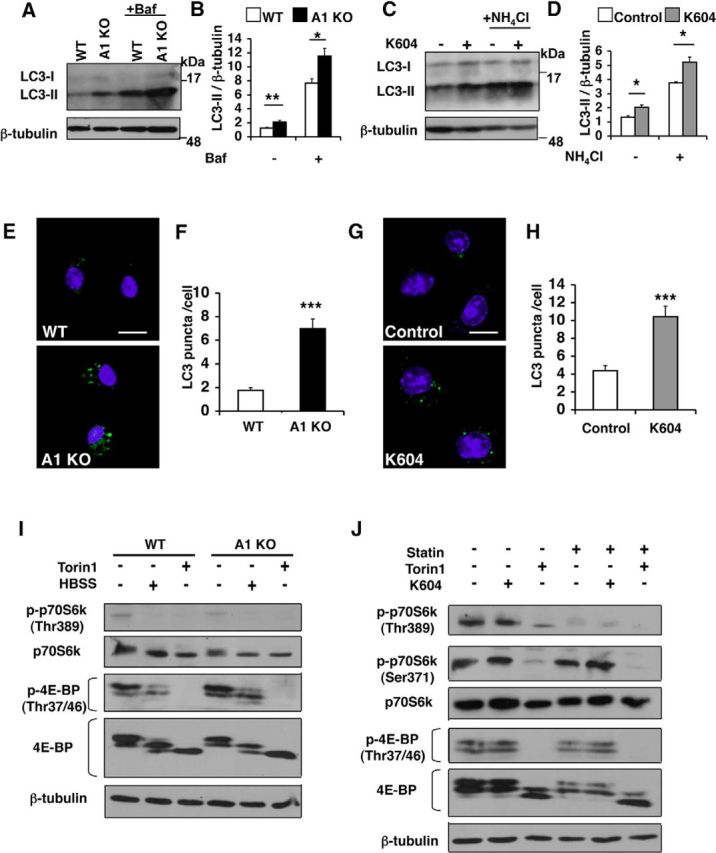
Blocking ACAT1 caused an increase in autophagy flux in an mTOR-independent manner. A, B, Microglia were treated with or without 0.25 μm Baf for 3 h. Cell lysates were analyzed by Western blot for LC3. A, Representative blot. B, Values are mean ± SEM of three experiments. *p < 0.05. **p < 0.01. C, D, N9 cells were treated with 0.5 μm K604 for 8 h, with or without 25 mm NH4Cl for the last 3 h of incubation. Cell lysates were analyzed by Western blot for LC3. C, Representative blot. D, Values are mean ± SEM of three experiments. *p < 0.01. E, F, Microglia were immunostained: LC3 (green) and DAPI (blue). E, Representative pictures. Scale bar, 10 μm. F, Numbers of LC3 puncta per cell were counted in at least 50 cells/genotype using ImageJ software. Values are mean ± SEM. ***p < 0.001. G, H, N9 cells were incubated with or without 0.5 μm K604 for 8 h and immunostained: LC3 (green) and DAPI (blue). G, Representative pictures. Scale bar, 10 μm. H, Numbers of LC3 puncta per cell were counted in at least 70 cells/condition using ImageJ software. Values are mean ± SEM. ***p < 0.001. I, WT or A1 KO microglia were incubated with 0.25 μm Torin1 or with Hanks Balanced Salt Solution (HBSS) only for 3 h. Cell lysates were analyzed by Western blot for phospho and total levels of, p70S6K and 4E-BP. The blot shown is representative of two experiments. J, N9 cells were grown in the absence or presence of 50 μm lovastatin (statin) and 230 μm mevalonate for 48 h. Cells were then incubated with 0.5 μm K604 for 8 h or with 0.25 μm Torin1 for 3 h in the absence or presence of statin/mevalonate. mTOR activity was analyzed by Western blot for phospho and total levels of p70S6K and 4E-BP. The blot shown is representative of two experiments.