Figure 6.
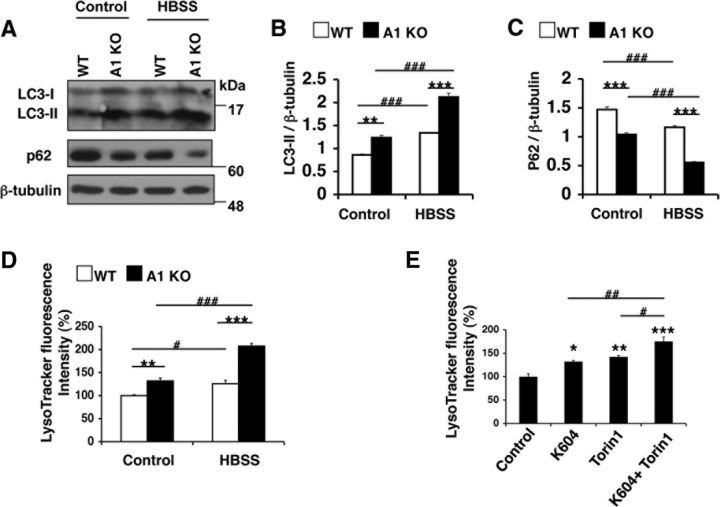
ACAT1 blockage and mTOR inhibition produced additive effects on autophagy flux and lysosome volume. A–D, Microglia were incubated in HBSS only for 3 h. A, Cell lysates were analyzed by Western blot for LC3 and for p62. Representative Western blot. B, C, Data are mean ± SEM of three experiments. **p < 0.01. ***p < 0.001. D, Cellular acidic compartments were analyzed by LysoTracker staining (50 nm, 30 min) followed by flow cytometry. Values are mean ± SEM of three experiments. **p < 0.01. ***p < 0.001. #p < 0.05. ###p < 0.001. E, N9 cells were treated with various inhibitors as indicated (0.5 μm K604 for 8 h, or 0.25 μm Torin1 for 3 h, or 0.5 μm K604 for 8 h and 0.25 μm Torin1 for the last 3 h of incubation). Cellular acidic compartments were analyzed by LysoTracker staining (50 nm, 30 min) followed by flow cytometry. Values are mean ± SEM of three experiments. *p < 0.05. **p < 0.01. ***p < 0.001. #p < 0.05. ##p < 0.01.

