
Figure 7.
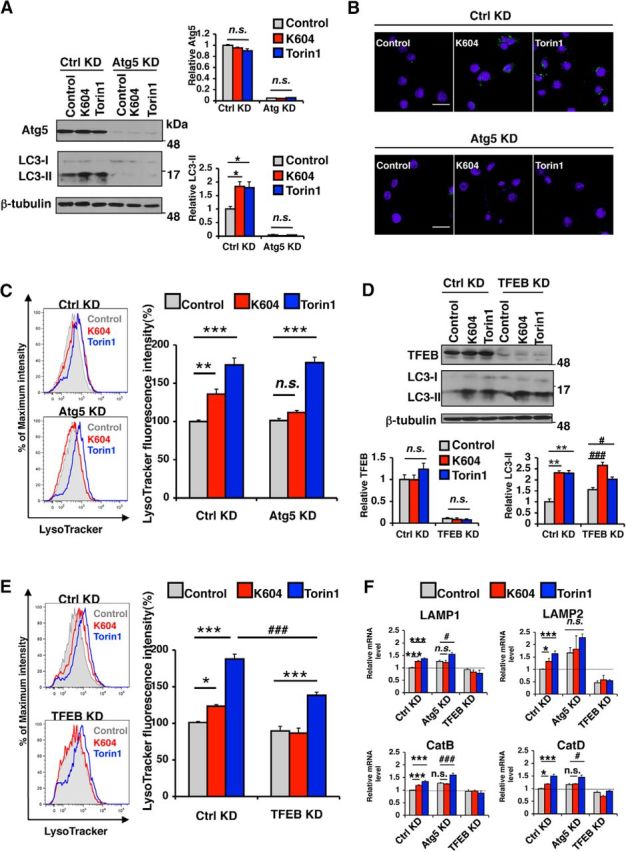
The effect of ACAT1 inhibition on lysosome biogenesis depended on autophagosome formation and on TFEB. A–E, F, N9 cells were transfected with control siRNA (Ctrl KD), or Atg5 siRNA (Atg5 KD) or TFEB siRNA (TFEB KD) for 72 h in RPMI containing 10% FBS and then incubated in fresh medium with 0.5 μm K604 for 8 h or with 0.25 μm Torin1 for 3 h. A, Cell lysates were analyzed by Western blot for Atg5 and for LC3. Representative blot. Quantification data are mean ± SEM of two experiments. *p < 0.05. n.s., Not significant. B, N9 cells were immunostained with anti-LC3 antibody (green) and DAPI (blue) and visualized under confocal microscopy. Scales bar, 20 μm. C, E, Cellular acidic compartments were analyzed by LysoTracker staining (50 nm, 30 min) followed by flow cytometry. Representative histograms. Relative fluorescence intensity data were results of three experiments. Values are mean ± SEM of three experiments. *p < 0.05. **p < 0.01. ***p < 0.001. ###p < 0.001. n.s., Not significant. D, Cell lysates were analyzed by Western blot for TFEB and LC3. Representative blot. Quantification data are mean ± SEM of two experiments. **p < 0.01. #p < 0.05. ###p < 0.001. n.s., Not significant. F, Expression levels of lysosome-specific genes were analyzed by qPCR. Data are mean ± SEM of four experiments. *p < 0.05. ***p < 0.001. #p < 0.05. ###p < 0.001. n.s., Not significant.