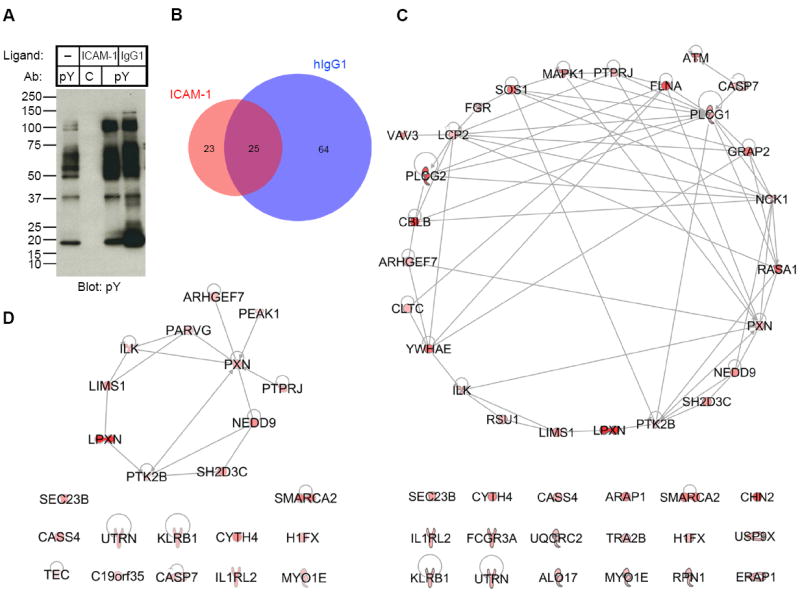
Fig. 1. Components of β2 Integrin Outside-In Signaling Identified by Mass Spectrometry.

(A) Anti-phosphotyrosine (pY) immunoblot of samples used for mass spectrometry analysis. Tyrosine phosphorylated proteins and associated proteins were pulled-down with mAb 4G10 (pY) or isotype control IgG2b mAb MOPC141 (C) from lysates of primary NK cells stimulated on plates for 20 min with BSA only (–), ICAM-1, and human IgG1, as indicated. Samples were eluted with sodium phenyl phosphate, run on SDS-PAGE, and immunoblotted with mAb 4G10. (B) Venn diagram of the number of proteins identified by mass spectrometry in the samples stimulated with ICAM-1 or human IgG1, after subtraction of proteins in the control samples. Selection criteria are described in Table S4 to S6. (C) Ingenuity Pathway Analysis (IPA, http://www.ingenuity.com) of the proteins identified in the sample stimulated with ICAM-1 (Table S4). The intensity of the red color indicates the score from mass spectrometry analysis. (D) Network analysis of the 23 proteins in the sample stimulated with ICAM-1 that had higher scores than the sample stimulated with human IgG1 (Table S6).
