
Fig. 3. Regional Distribution of Transgene and Fos Expression in the PVN after Hypertonic Stress.
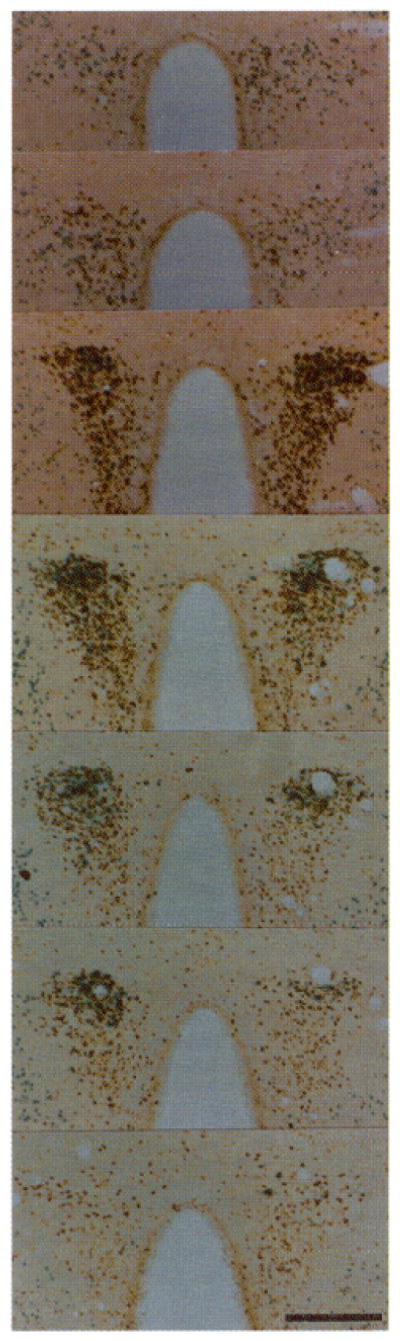
Serial sections (50 μm) taken every 100 μm are shown from rostral (top) to caudal (bottom) regions of the PVN stained for β-galactosidase activity and Fos immunoreactivity 6 h after hypertonic saline. The enhanced intensity of Fos staining seen in the double labeling experiments appears to result from processing sections through the X-Gal solution (see Materials and Methods). Magnification: horizontal bar = 250 μm.