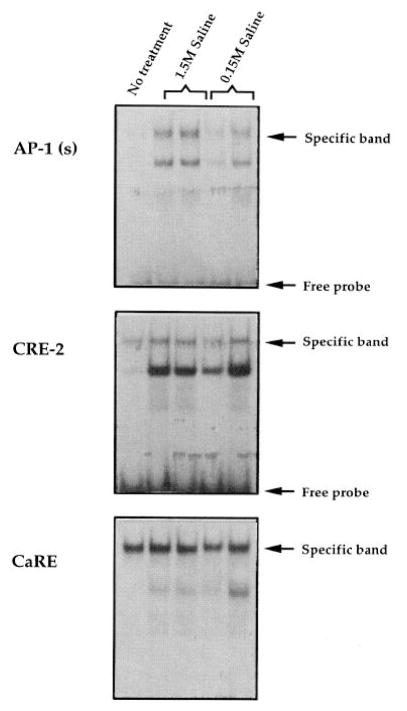
Fig. 8. Gel Shifts Showing the Effects of Stress on Binding in Extracts from PVN.
Each lane represents extracts made from the PVN regions pooled from three animals. For each oligonucleotide, the first lane represents no treatment, the next two lanes represent 1.5 M saline injection, and the last two lanes represent 0.15 M saline injection. Animals were killed 2 h after injection. Each saline condition is represented by two lanes, each representing an independent experiment. The arrows point to a specific band, as determined by competition analysis (see Fig. 7). Top, AP-1 oligonucleotide. Middle, CRE-2 oligonucleotide. Bottom, CaRE oligonucleotide.

